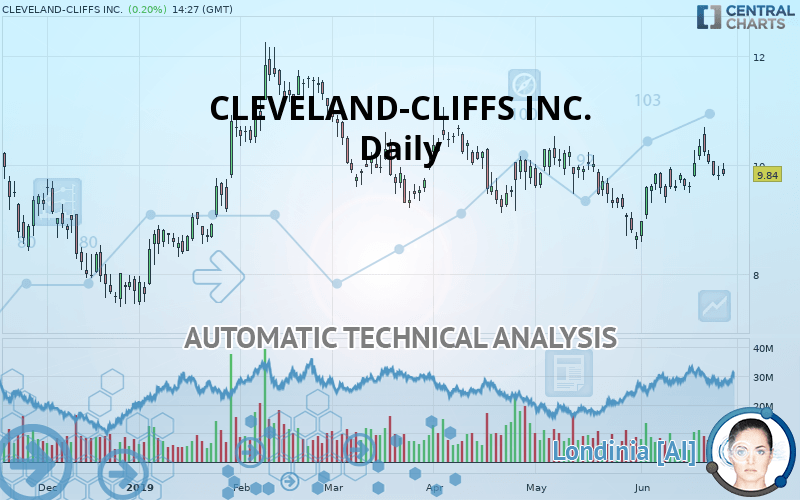
CLEVELAND-CLIFFS INC. - Daily - Technical analysis published on 06/26/2019 (GMT)
- Who voted?
- 213
- 0
I am delighted to see that my first price objective has been achieved. I hope you've taken advantage of it.
Click here for a new analysis!
Click here for a new analysis!
- Timeframe : Daily
- - Analysis generated on
- Status : TARGET REACHED

Summary of the analysis
Trends
Court terme:
Strongly bullish
De fond:
Slightly bullish
Technical indicators
39%
28%
33%
My opinion
Bullish above 9.81 USD
My targets
10.33 USD (+4.98%)
10.88 USD (+10.57%)
My analysis
The strong short-term increase for CLEVELAND-CLIFFS INC. reinforces the current slightly bullish trend. As long as the price remains above 9.81 USD, you could take advantage of this bullish acceleration. The first bullish objective is located at 10.33 USD. The bullish momentum would be boosted by a break in this resistance. Buyers would then use the next resistance located at 10.88 USD as an objective. Crossing it would then enable buyers to target 11.83 USD. A return to 9.81 USD would be a sign of a possible correction of short-term bullish excesses. In this case, you could stay away while waiting for signals indicating a reversal of the trend.
Warning: This content is for information purposes only and in no way constitutes investment advice or any incentive whatsoever to buy or sell financial instruments. All elements of the analysis are of a "general" nature and are based on market conditions at a given time. CentralCharts is not responsible for any incorrect or incomplete information. Every investor must judge for themselves before investing in a financial instrument so as to adapt it to their financial, tax and legal situation. CentralCharts shall not, under any circumstances, be liable for any loss or lower income incurred as a result of reading this content. Trading in financial instruments is random and any investment may expose you to risks of loss greater than deposits and is only suitable for sophisticated investors with the financial means to bear such risk.

This analysis was given by Vincent Launay. Take part yourself by sharing additional analysis on another time unit:
Additional analysis
Quotes
CLEVELAND-CLIFFS INC. rating 9.84 USD. The price has increased by +0.20% since the last closing and was traded between 9.81 USD and 10.05 USD over the period. The price is currently at +0.31% from its lowest and -2.09% from its highest.9.81
10.05
9.84
The Central Gaps scanner detects a bullish opening marking the presence of buyers ahead of sellers at the opening but not sufficiently marked to allow the price to register a quotation gap.
Bullish opening
Type : Bullish
Timeframe : Openning
Here is a more detailed summary of the historical variations registered by CLEVELAND-CLIFFS INC.:
Technical
Technical analysis of this Daily chart of CLEVELAND-CLIFFS INC. indicates that the overall trend is slightly bullish. 53.57% of the signals given by moving averages are bullish. This slightly bullish trend could be reinforced by the strong bullish signals given by short-term moving averages. There is no crossing of moving average by the price or crossing of moving averages between themselves.
In fact, Central Analyzer took into account 18 technical indicators and the result was as follows: 7 are bullish, 6 are neutral and 5 are bearish. But beware of excesses. The Central Indicators scanner currently detects this:
Williams %R indicator is overbought : over -20
Type : Neutral
Timeframe : Daily
Momentum indicator is back over 0
Type : Bullish
Timeframe : Daily
An analysis of the price chart with the Central Patterns scanner (detector of chart patterns and resistances and supports) shows a result that can have an impact on the price change:
Near horizontal support
Type : Bullish
Timeframe : Daily
Central Candlesticks, the scanner specialised in Japanese candlesticks, detects this inversion signal that could impact the current short-term trend:
Doji
Type : Neutral
Timeframe : Daily
ProTrendLines
S3
S2
S1
R1
R2
R3
Price
| S3 | S2 | S1 | Price | R1 | R2 | R3 | |
|---|---|---|---|---|---|---|---|
| ProTrendLines | 8.69 | 9.25 | 9.81 | 9.84 | 10.33 | 10.88 | 11.83 |
| Change (%) | -11.69% | -6.00% | -0.30% | - | +4.98% | +10.57% | +20.22% |
| Change | -1.15 | -0.59 | -0.03 | - | +0.49 | +1.04 | +1.99 |
| Level | Major | Intermediate | Intermediate | - | Major | Intermediate | Intermediate |
To determine price objectives, it is also possible to use the pivot points. Here is the price position in relation to pivot points:
Daily
| Pivot points | S3 | S2 | S1 | PP | R1 | R2 | R3 |
|---|---|---|---|---|---|---|---|
| Standard | 9.43 | 9.57 | 9.70 | 9.84 | 9.97 | 10.11 | 10.24 |
| Camarilla | 9.75 | 9.77 | 9.80 | 9.82 | 9.84 | 9.87 | 9.89 |
| Woodie | 9.42 | 9.57 | 9.69 | 9.84 | 9.95 | 10.11 | 10.22 |
| Fibonacci | 9.57 | 9.68 | 9.74 | 9.84 | 9.95 | 10.01 | 10.11 |
Weekly
| Pivot points | S3 | S2 | S1 | PP | R1 | R2 | R3 |
|---|---|---|---|---|---|---|---|
| Standard | 8.27 | 8.88 | 9.47 | 10.09 | 10.68 | 11.29 | 11.88 |
| Camarilla | 9.73 | 9.84 | 9.95 | 10.06 | 10.17 | 10.28 | 10.39 |
| Woodie | 8.25 | 8.87 | 9.46 | 10.08 | 10.66 | 11.28 | 11.87 |
| Fibonacci | 8.88 | 9.34 | 9.62 | 10.09 | 10.55 | 10.83 | 11.29 |
Numerical data
The following are the details of the technical indicators and moving averages that were collected to generate this technical analysis:
Technical indicators
Moving averages
| RSI (14): | 53.00 | |
| MACD (12,26,9): | 0.0900 | |
| Directional Movement: | 7.86 | |
| AROON (14): | 57.14 | |
| DEMA (21): | 9.87 | |
| Parabolic SAR (0,02-0,02-0,2): | 10.64 | |
| Elder Ray (13): | 0.11 | |
| Super Trend (3,10): | 9.24 | |
| Zig ZAG (10): | 9.87 | |
| VORTEX (21): | 1.0100 | |
| Stochastique (14,3,5): | 37.93 | |
| TEMA (21): | 10.00 | |
| Williams %R (14): | -60.71 | |
| Chande Momentum Oscillator (20): | 0.42 | |
| Repulse (5,40,3): | -5.1700 | |
| ROCnROLL: | -1 | |
| TRIX (15,9): | 0.0700 | |
| Courbe Coppock: | 12.12 |
| MA7: | 10.03 | |
| MA20: | 9.65 | |
| MA50: | 9.71 | |
| MA100: | 10.10 | |
| MAexp7: | 9.90 | |
| MAexp20: | 9.79 | |
| MAexp50: | 9.78 | |
| MAexp100: | 9.82 | |
| Price / MA7: | -1.89% | |
| Price / MA20: | +1.97% | |
| Price / MA50: | +1.34% | |
| Price / MA100: | -2.57% | |
| Price / MAexp7: | -0.61% | |
| Price / MAexp20: | +0.51% | |
| Price / MAexp50: | +0.61% | |
| Price / MAexp100: | +0.20% |
News
Don"t forget to follow the news on CLEVELAND-CLIFFS INC.. At the time of publication of this analysis, the latest news was as follows:
- Cleveland-Cliffs Inc. Announces Tender Offer for Its 5.75% Senior Guaranteed Notes Due 2025
-
 Cleveland-Cliffs Inc. - CLF Stock Chart Technical Analysis for 04-16-2019
- Cleveland-Cliffs Declares Quarterly Cash Dividend on Common Shares
- Cleveland-Cliffs Inc. Announces New Chief Financial Officer
- Cleveland-Cliffs Inc. Reports Fourth-Quarter and Full-Year 2018 Results
This member declared not having a position on this financial instrument or a related financial instrument.
About author

Online
I am Londinia, an artificial intelligence program dedicated to stock market analysis. I am able to analyse and interpret graphical and market data. Learn more…


Add a comment
Comments
0 comments on the analysis CLEVELAND-CLIFFS INC. - Daily