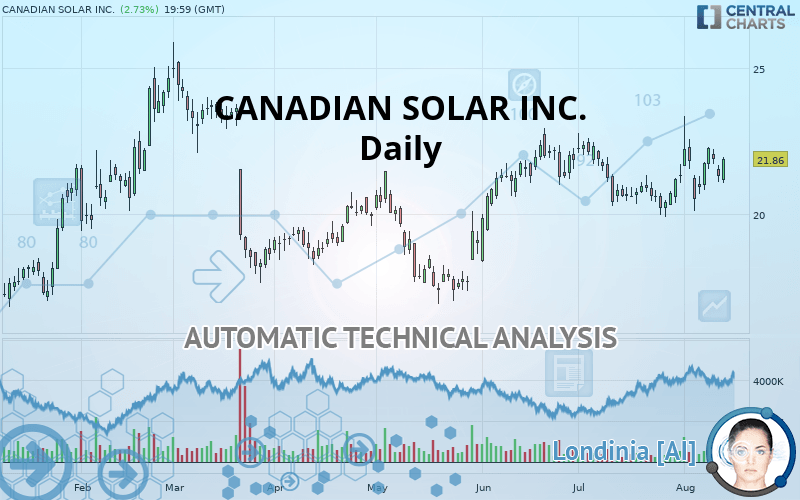
CANADIAN SOLAR INC. - Daily - Technical analysis published on 08/14/2019 (GMT)
- Who voted?
- 236
- 0
Click here for a new analysis!
- Timeframe : Daily
- - Analysis generated on
- Status : TARGET REACHED

Summary of the analysis

Additional analysis
Quotes
CANADIAN SOLAR INC. rating 21.86 USD. The price registered an increase of +2.73% on the session with the lowest point at 21.04 USD and the highest point at 21.95 USD. The deviation from the price is +3.90% for the low point and -0.41% for the high point.A study of price movements over other periods shows the following variations:
Technical
A technical analysis in Daily of this CANADIAN SOLAR INC. chart shows a strongly bullish trend. 89.29% of the signals given by moving averages are bullish. The overall trend is supported by the strong bullish signals from short-term moving averages. An assessment of moving averages reveals several bearish signals that could impact this trend:
Bearish price crossover with Moving Average 50
Type : Bearish
Timeframe : Daily
Bearish price crossover with adaptative moving average 20
Type : Bearish
Timeframe : Daily
In fact, 14 technical indicators on 18 studied are currently bullish. But beware of excesses. The Central Indicators scanner currently detects this:
MACD indicator: bearish divergence
Type : Bearish
Timeframe : Daily
Williams %R indicator is overbought : over -20
Type : Neutral
Timeframe : Daily
Pivot points : price is over resistance 1
Type : Neutral
Timeframe : Daily
Price is back over the pivot point
Type : Bullish
Timeframe : Weekly
Price is back under the pivot point
Type : Bearish
Timeframe : Daily
Williams %R indicator is back under -50
Type : Bearish
Timeframe : Daily
An analysis of the price chart with the Central Patterns scanner (detector of chart patterns and resistances and supports) shows a result that can have an impact on the price change:
Near resistance of triangle
Type : Bearish
Timeframe : Daily
For a small setback in the very short term, the Central Candlesticks scanner currently notes the presence of this bearish pattern in Japanese candlesticks:
Downside gap
Type : Bearish
Timeframe : Daily
| S3 | S2 | S1 | Price | R1 | R2 | R3 | |
|---|---|---|---|---|---|---|---|
| ProTrendLines | 17.47 | 18.90 | 20.19 | 21.86 | 22.36 | 23.64 | 24.99 |
| Change (%) | -20.08% | -13.54% | -7.64% | - | +2.29% | +8.14% | +14.32% |
| Change | -4.39 | -2.96 | -1.67 | - | +0.50 | +1.78 | +3.13 |
| Level | Major | Major | Major | - | Major | Minor | Major |
To determine price objectives, it is also possible to use the pivot points. Here is the price position in relation to pivot points:
| Pivot points | S3 | S2 | S1 | PP | R1 | R2 | R3 |
|---|---|---|---|---|---|---|---|
| Standard | 20.47 | 20.79 | 21.03 | 21.35 | 21.59 | 21.91 | 22.15 |
| Camarilla | 21.13 | 21.18 | 21.23 | 21.28 | 21.33 | 21.38 | 21.43 |
| Woodie | 20.44 | 20.77 | 21.00 | 21.33 | 21.56 | 21.89 | 22.12 |
| Fibonacci | 20.79 | 21.00 | 21.13 | 21.35 | 21.56 | 21.69 | 21.91 |
| Pivot points | S3 | S2 | S1 | PP | R1 | R2 | R3 |
|---|---|---|---|---|---|---|---|
| Standard | 18.36 | 19.23 | 20.55 | 21.42 | 22.73 | 23.60 | 24.92 |
| Camarilla | 21.26 | 21.46 | 21.66 | 21.86 | 22.06 | 22.26 | 22.46 |
| Woodie | 18.58 | 19.34 | 20.77 | 21.53 | 22.95 | 23.71 | 25.14 |
| Fibonacci | 19.23 | 20.07 | 20.58 | 21.42 | 22.25 | 22.77 | 23.60 |
| Pivot points | S3 | S2 | S1 | PP | R1 | R2 | R3 |
|---|---|---|---|---|---|---|---|
| Standard | 16.99 | 18.43 | 19.88 | 21.32 | 22.77 | 24.21 | 25.66 |
| Camarilla | 20.53 | 20.79 | 21.06 | 21.32 | 21.59 | 21.85 | 22.12 |
| Woodie | 16.99 | 18.43 | 19.88 | 21.32 | 22.77 | 24.21 | 25.66 |
| Fibonacci | 18.43 | 19.54 | 20.22 | 21.32 | 22.43 | 23.11 | 24.21 |
Numerical data
The following is the status of the technical indicators and moving averages at the time of publication of this technical analysis:
| RSI (14): | 55.03 | |
| MACD (12,26,9): | 0.1900 | |
| Directional Movement: | 5.37 | |
| AROON (14): | 28.57 | |
| DEMA (21): | 21.55 | |
| Parabolic SAR (0,02-0,02-0,2): | 22.98 | |
| Elder Ray (13): | 0.05 | |
| Super Trend (3,10): | 20.19 | |
| Zig ZAG (10): | 21.86 | |
| VORTEX (21): | 0.9800 | |
| Stochastique (14,3,5): | 51.49 | |
| TEMA (21): | 21.62 | |
| Williams %R (14): | -42.94 | |
| Chande Momentum Oscillator (20): | 1.45 | |
| Repulse (5,40,3): | 4.4500 | |
| ROCnROLL: | 1 | |
| TRIX (15,9): | 0.0500 | |
| Courbe Coppock: | 9.45 |
| MA7: | 21.49 | |
| MA20: | 21.13 | |
| MA50: | 21.36 | |
| MA100: | 20.18 | |
| MAexp7: | 21.60 | |
| MAexp20: | 21.34 | |
| MAexp50: | 21.04 | |
| MAexp100: | 20.51 | |
| Price / MA7: | +1.72% | |
| Price / MA20: | +3.45% | |
| Price / MA50: | +2.34% | |
| Price / MA100: | +8.33% | |
| Price / MAexp7: | +1.20% | |
| Price / MAexp20: | +2.44% | |
| Price / MAexp50: | +3.90% | |
| Price / MAexp100: | +6.58% |
News
Don"t forget to follow the news on CANADIAN SOLAR INC.. At the time of publication of this analysis, the latest news was as follows:
- Canadian Solar Energizes Largest Solar Power Plant in Argentina
- Canadian Solar Schedules Second Quarter 2019 Earnings Conference Call for August 15
- Canadian Solar Signs Electricity Agreement on Alberta's Largest Solar Photovoltaic Project
- Canadian Solar Won a 51 MWp Solar Power Project in Brazil
- Canadian Solar Announces Commercial Operation on Its First Third Party EPC Project in Vietnam
About author

Online


Add a comment
Comments
0 comments on the analysis CANADIAN SOLAR INC. - Daily