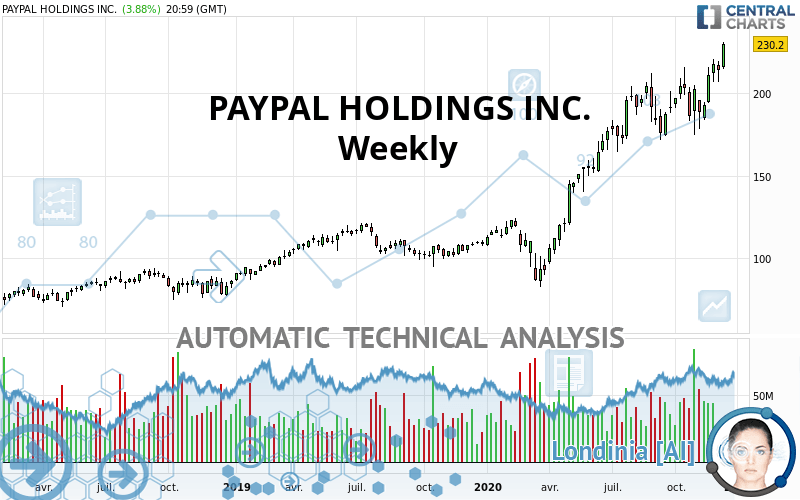
PAYPAL HOLDINGS INC. - Weekly - Technical analysis published on 12/17/2020 (GMT)
- 259
- 0
Click here for a new analysis!
- Timeframe : Weekly
- - Analysis generated on
- Status : TARGET REACHED
Summary of the analysis

Additional analysis
Quotes
PAYPAL HOLDINGS INC. rating 230.20 USD. Over 5 days, this instrument gained +6.90% and was traded between 215.00 USD and 231.15 USD over the period. The price is currently at +7.07% from its lowest point and -0.41% from its highest point.The Central Gaps scanner detects the formation of a bullish gap marking the strong presence of buyers against sellers at the opening. This formed a quotation gap.
Opening Gap UP
Type : Bullish
Timeframe : Openning
So that you have an overall view of the price change, here is a table showing the variations over several periods:
New HIGH record (5 years)
Type : Bullish
Timeframe : Weekly
Near a new HIGH record (5 years)
Type : Bullish
Timeframe : Weekly
New HIGH record (1 year)
Type : Bullish
Timeframe : Weekly
New HIGH record (1st january)
Type : Bullish
Timeframe : Weekly
New HIGH record (1 month)
Type : Bullish
Timeframe : Weekly
Technical
Technical analysis of this Weekly chart of PAYPAL HOLDINGS INC. indicates that the overall trend is strongly bullish. 92.86% of the signals given by moving averages are bullish. This strongly bullish trend is supported by the strong bullish signals given by short-term moving averages. There is no crossing of moving average by the price or crossing of moving averages between themselves.
An assessment of technical indicators shows a strong bullish signal.
But beware of excesses. The Central Indicators scanner currently detects this:
CCI indicator is overbought : over 100
Type : Neutral
Timeframe : Weekly
Previous candle closed over Bollinger bands
Type : Neutral
Timeframe : Weekly
Williams %R indicator is overbought : over -20
Type : Neutral
Timeframe : Weekly
Pivot points : price is over resistance 2
Type : Neutral
Timeframe : Weekly
Central Patterns, the market scanner focusing on chart patterns, resistances and supports found this result:
Resistance of channel is broken
Type : Bullish
Timeframe : Weekly
The presence of a bearish pattern in Japanese candlesticks detected by Central Candlesticks that could cause a correction in the very short term was also detected:
Bearish harami
Type : Bearish
Timeframe : Weekly
| S3 | S2 | S1 | Price | |
|---|---|---|---|---|
| ProTrendLines | 121.30 | 179.81 | 213.07 | 230.20 |
| Change (%) | -47.31% | -21.89% | -7.44% | - |
| Change | -108.90 | -50.39 | -17.13 | - |
| Level | Minor | Intermediate | Major | - |
Pivot points can also be used to set your price objectives. Here is the price situation in relation to pivot points:
| Pivot points | S3 | S2 | S1 | PP | R1 | R2 | R3 |
|---|---|---|---|---|---|---|---|
| Standard | 213.19 | 215.15 | 218.38 | 220.34 | 223.57 | 225.53 | 228.76 |
| Camarilla | 220.17 | 220.65 | 221.12 | 221.60 | 222.08 | 222.55 | 223.03 |
| Woodie | 213.82 | 215.47 | 219.01 | 220.66 | 224.20 | 225.85 | 229.39 |
| Fibonacci | 215.15 | 217.14 | 218.36 | 220.34 | 222.33 | 223.55 | 225.53 |
| Pivot points | S3 | S2 | S1 | PP | R1 | R2 | R3 |
|---|---|---|---|---|---|---|---|
| Standard | 194.70 | 200.67 | 207.37 | 213.34 | 220.04 | 226.01 | 232.71 |
| Camarilla | 210.58 | 211.74 | 212.90 | 214.06 | 215.22 | 216.38 | 217.54 |
| Woodie | 195.06 | 200.85 | 207.73 | 213.52 | 220.40 | 226.19 | 233.07 |
| Fibonacci | 200.67 | 205.51 | 208.50 | 213.34 | 218.18 | 221.17 | 226.01 |
| Pivot points | S3 | S2 | S1 | PP | R1 | R2 | R3 |
|---|---|---|---|---|---|---|---|
| Standard | 146.00 | 160.41 | 187.26 | 201.67 | 228.52 | 242.93 | 269.78 |
| Camarilla | 202.77 | 206.56 | 210.34 | 214.12 | 217.90 | 221.68 | 225.47 |
| Woodie | 152.23 | 163.52 | 193.49 | 204.78 | 234.75 | 246.04 | 276.01 |
| Fibonacci | 160.41 | 176.17 | 185.91 | 201.67 | 217.43 | 227.17 | 242.93 |
Numerical data
The following is the status of technical indicators and moving averages registered at the time this technical analysis was created:
| RSI (14): | 67.85 | |
| MACD (12,26,9): | 15.0800 | |
| Directional Movement: | 15.65 | |
| AROON (14): | 92.86 | |
| DEMA (21): | 216.96 | |
| Parabolic SAR (0,02-0,02-0,2): | 179.16 | |
| Elder Ray (13): | 18.85 | |
| Super Trend (3,10): | 173.68 | |
| Zig ZAG (10): | 230.20 | |
| VORTEX (21): | 1.1000 | |
| Stochastique (14,3,5): | 93.13 | |
| TEMA (21): | 217.97 | |
| Williams %R (14): | -1.60 | |
| Chande Momentum Oscillator (20): | 42.95 | |
| Repulse (5,40,3): | 13.8400 | |
| ROCnROLL: | 1 | |
| TRIX (15,9): | 1.2400 | |
| Courbe Coppock: | 20.39 |
| MA7: | 218.53 | |
| MA20: | 211.48 | |
| MA50: | 202.39 | |
| MA100: | 197.83 | |
| MAexp7: | 211.90 | |
| MAexp20: | 196.61 | |
| MAexp50: | 169.23 | |
| MAexp100: | 142.34 | |
| Price / MA7: | +5.34% | |
| Price / MA20: | +8.85% | |
| Price / MA50: | +13.74% | |
| Price / MA100: | +16.36% | |
| Price / MAexp7: | +8.64% | |
| Price / MAexp20: | +17.08% | |
| Price / MAexp50: | +36.03% | |
| Price / MAexp100: | +61.73% |
News
The last news published on PAYPAL HOLDINGS INC. at the time of the generation of this analysis was as follows:
- PayPal Processed More than $185 Million in Donations this GivingTuesday in A Year Unlike Any Other
- PayPal Launches Enhanced Giving Platform to Put the Power of Fundraising in Customer's Hands this Holiday
- PayPal Partners with Even to Provide New Tools to Improve the Financial Health of its Workforce
- CVS Pharmacy is First National Retailer to Offer Touch-Free Payments Through PayPal And Venmo
-
 PayPal Holdings, Inc. - PYPL Stock Chart Technical Analysis for 11-03-2020
About author

Online


Add a comment
Comments
0 comments on the analysis PAYPAL HOLDINGS INC. - Weekly