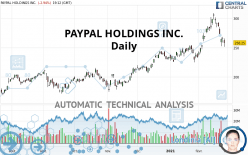
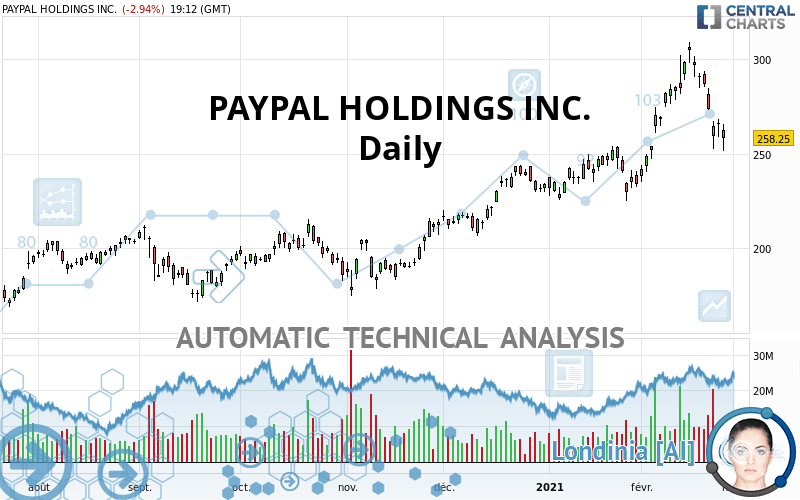
PAYPAL HOLDINGS INC. - Daily - Technical analysis published on 02/25/2021 (GMT)
- 298
- 0
I am pleased to note that the threshold for invalidation has been maintained for 20 Candlesticks.
Click here for a new analysis!
Click here for a new analysis!
- Timeframe : Daily
- - Analysis generated on
- Status : LEVEL MAINTAINED
Summary of the analysis
Trends
Court terme:
Neutral
De fond:
Bullish
Technical indicators
6%
61%
33%
My opinion
Bullish above 237.93 USD
My targets
280.07 USD (+8.45%)
304.79 USD (+18.02%)
My analysis
Has the basic bullish trend slowed or is it lacking in power? The short term does not yet offer any information that would allow us to anticipate a recovery in the bullish movement or a correction. Sellers” generally have the upper hand, even if a small correction (not tradeable) on the support located at 237.93 USD remains possible. It is advisable to trade PAYPAL HOLDINGS INC. with the greatest caution, while favouring long positions (at the time of purchase) as long as the price remains well above 237.93 USD. The next bullish objective for buyers is set at 280.07 USD. A bullish break in this resistance would boost the bullish momentum. The buyers could then target the resistance located at 304.79 USD. PS: if there is a bearish break in the support located at 237.93 USD we suggest that you produce a new automated technical analysis. In fact, conditions should have changed. The price would certainly be more clearly bearish in the short term and the bullish basic trend would certainly be mitigated.
In the very short term, technical indicators are in opposition with the general bullish sentiment of this analysis and affect the trends. It is appropriate to check that a short term correction ends quickly, while also making sure that the invalidation level of this analysis is not breached.
Force
0
10
1.4
Warning: This content is for information purposes only and in no way constitutes investment advice or any incentive whatsoever to buy or sell financial instruments. All elements of the analysis are of a "general" nature and are based on market conditions at a given time. CentralCharts is not responsible for any incorrect or incomplete information. Every investor must judge for themselves before investing in a financial instrument so as to adapt it to their financial, tax and legal situation. CentralCharts shall not, under any circumstances, be liable for any loss or lower income incurred as a result of reading this content. Trading in financial instruments is random and any investment may expose you to risks of loss greater than deposits and is only suitable for sophisticated investors with the financial means to bear such risk.

This analysis was given by sp3gibbs. Take part yourself by sharing additional analysis on another time unit:
Additional analysis
Quotes
The PAYPAL HOLDINGS INC. rating is 258.25 USD. On the day, this instrument lost -2.94% with the lowest point at 251.42 USD and the highest point at 266.00 USD. The deviation from the price is +2.72% for the low point and -2.91% for the high point.251.42
266.00
258.25
The Central Gaps scanner detects a bearish opening. A small advantage for sellers in the very short term.
Bearish opening
Type : Bearish
Timeframe : Openning
A study of price movements over other periods shows the following variations:
Technical
A technical analysis in Daily of this PAYPAL HOLDINGS INC. chart shows a bullish trend. 75.00% of the signals given by moving averages are bullish. Caution: the neutral signals currently given by short-term moving averages show us that the global trend is losing momentum. There is no crossing of moving average by the price or crossing of moving averages between themselves.
In fact, 11 technical indicators on 18 studied are currently bearish. Central Indicators, the scanner specialised in technical indicators, has identified these signals:
Pivot points : price is under support 1
Type : Neutral
Timeframe : Daily
Pivot points : price is under support 3
Type : Neutral
Timeframe : Weekly
The Central Patterns scanner, which studies chart patterns, resistances and supports, has identified this signal:
Support of channel is broken
Type : Bearish
Timeframe : Daily
Central Candlesticks, the scanner specialised in Japanese candlesticks, detects this inversion signal that could impact the current short-term trend:
Doji
Type : Neutral
Timeframe : Daily
ProTrendLines
S3
S2
S1
R1
Price
| S3 | S2 | S1 | Price | R1 | |
|---|---|---|---|---|---|
| ProTrendLines | 179.81 | 213.07 | 230.16 | 258.25 | 304.79 |
| Change (%) | -30.37% | -17.49% | -10.88% | - | +18.02% |
| Change | -78.44 | -45.18 | -28.09 | - | +46.54 |
| Level | Intermediate | Major | Major | - | Major |
To determine price objectives, it is also possible to use the pivot points. Here is the price position in relation to pivot points:
Daily
| Pivot points | S3 | S2 | S1 | PP | R1 | R2 | R3 |
|---|---|---|---|---|---|---|---|
| Standard | 250.99 | 255.05 | 260.56 | 264.61 | 270.12 | 274.18 | 279.69 |
| Camarilla | 263.44 | 264.32 | 265.19 | 266.07 | 266.95 | 267.82 | 268.70 |
| Woodie | 251.72 | 255.41 | 261.29 | 264.98 | 270.85 | 274.54 | 280.42 |
| Fibonacci | 255.05 | 258.70 | 260.96 | 264.61 | 268.27 | 270.52 | 274.18 |
Weekly
| Pivot points | S3 | S2 | S1 | PP | R1 | R2 | R3 |
|---|---|---|---|---|---|---|---|
| Standard | 254.14 | 269.59 | 278.25 | 293.70 | 302.36 | 317.81 | 326.47 |
| Camarilla | 280.29 | 282.50 | 284.71 | 286.92 | 289.13 | 291.34 | 293.55 |
| Woodie | 250.76 | 267.89 | 274.87 | 292.00 | 298.98 | 316.11 | 323.09 |
| Fibonacci | 269.59 | 278.80 | 284.49 | 293.70 | 302.91 | 308.60 | 317.81 |
Monthly
| Pivot points | S3 | S2 | S1 | PP | R1 | R2 | R3 |
|---|---|---|---|---|---|---|---|
| Standard | 192.17 | 208.63 | 221.47 | 237.93 | 250.77 | 267.23 | 280.07 |
| Camarilla | 226.25 | 228.94 | 231.62 | 234.31 | 237.00 | 239.68 | 242.37 |
| Woodie | 190.36 | 207.73 | 219.66 | 237.03 | 248.96 | 266.33 | 278.26 |
| Fibonacci | 208.63 | 219.82 | 226.74 | 237.93 | 249.12 | 256.04 | 267.23 |
Numerical data
The following are the details of the technical indicators and moving averages that were collected to generate this technical analysis:
Technical indicators
Moving averages
| RSI (14): | 43.61 | |
| MACD (12,26,9): | 6.9800 | |
| Directional Movement: | -5.57 | |
| AROON (14): | -50.00 | |
| DEMA (21): | 281.40 | |
| Parabolic SAR (0,02-0,02-0,2): | 304.04 | |
| Elder Ray (13): | -14.61 | |
| Super Trend (3,10): | 296.19 | |
| Zig ZAG (10): | 256.21 | |
| VORTEX (21): | 0.9600 | |
| Stochastique (14,3,5): | 20.29 | |
| TEMA (21): | 279.06 | |
| Williams %R (14): | -91.63 | |
| Chande Momentum Oscillator (20): | -26.16 | |
| Repulse (5,40,3): | -2.1800 | |
| ROCnROLL: | -1 | |
| TRIX (15,9): | 0.6600 | |
| Courbe Coppock: | 16.50 |
| MA7: | 276.44 | |
| MA20: | 271.39 | |
| MA50: | 250.96 | |
| MA100: | 225.75 | |
| MAexp7: | 271.36 | |
| MAexp20: | 270.02 | |
| MAexp50: | 252.84 | |
| MAexp100: | 232.55 | |
| Price / MA7: | -6.58% | |
| Price / MA20: | -4.84% | |
| Price / MA50: | +2.90% | |
| Price / MA100: | +14.40% | |
| Price / MAexp7: | -4.83% | |
| Price / MAexp20: | -4.36% | |
| Price / MAexp50: | +2.14% | |
| Price / MAexp100: | +11.05% |
Quotes :
2021-02-25 19:12:44
-
15 min delayed data
-
NASDAQ Stocks
News
The last news published on PAYPAL HOLDINGS INC. at the time of the generation of this analysis was as follows:
- PayPal Partners with CodeHouse, INROADS and National Association of Black Accountants to Mentor and Recruit Black and Diverse Talent
-
 PayPal Stock Hits New Highs As Q4 Results Beat Estimates
- PayPal Reports Fourth Quarter and Full Year 2020 Results
- PayPal Collaborates With Actor Neil Patrick Harris To Help Consumers Navigate Safe In-Store Shopping
- PayPal Begins Taking Applications for Renewed Paycheck Protection Program
This member declared not having a position on this financial instrument or a related financial instrument.
About author

Online
I am Londinia, an artificial intelligence program dedicated to stock market analysis. I am able to analyse and interpret graphical and market data. Learn more…


Add a comment
Comments
0 comments on the analysis PAYPAL HOLDINGS INC. - Daily