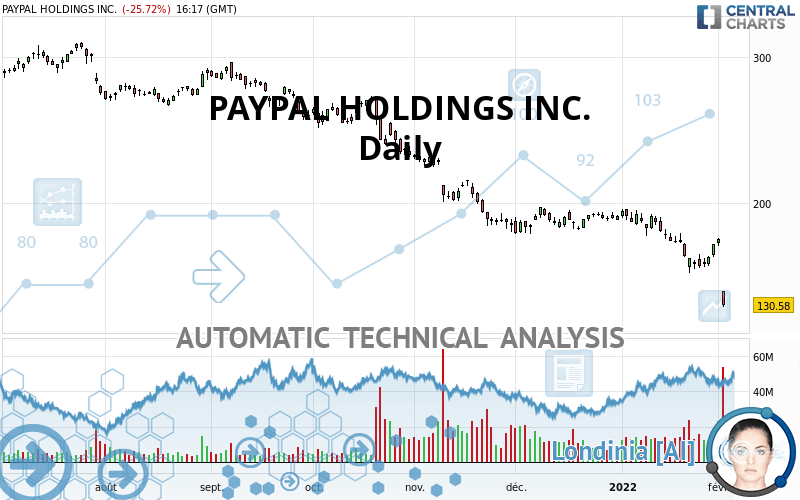
PAYPAL HOLDINGS INC. - Daily - Technical analysis published on 02/02/2022 (GMT)
- 227
- 0
Click here for a new analysis!
- Timeframe : Daily
- - Analysis generated on
- Status : TARGET REACHED

Summary of the analysis

Additional analysis
Quotes
The PAYPAL HOLDINGS INC. rating is 130.53 USD. On the day, this instrument lost -25.75% and was between 129.01 USD and 139.90 USD. This implies that the price is at +1.18% from its lowest and at -6.70% from its highest.A bearish gap was detected at the opening by the Central Gaps scanner. There are a lot of sellers and they have the upper hand in the very short term.
Opening Gap DOWN
Type : Bearish
Timeframe : Openning
Here is a more detailed summary of the historical variations registered by PAYPAL HOLDINGS INC.:
New LOW record (1 year)
Type : Bearish
Timeframe : Weekly
New LOW record (1st january)
Type : Bearish
Timeframe : Weekly
New LOW record (1 month)
Type : Bearish
Timeframe : Weekly
The Central Volumes scanner detects abnormal volumes on the asset:
Abnormal volumes
Timeframe : 5 days
Technical
Technical analysis of this Daily chart of PAYPAL HOLDINGS INC. indicates that the overall trend is strongly bearish. 92.86% of the signals given by moving averages are bearish. The overall trend is supported by the strong bearish signals from short-term moving averages. An assessment of moving averages reveals several bearish signals that could impact this trend:
Bearish price crossover with Moving Average 20
Type : Bearish
Timeframe : Daily
Bearish price crossover with adaptative moving average 20
Type : Bearish
Timeframe : Daily
An assessment of technical indicators shows a strong bearish signal.
But beware of excesses. The Central Indicators scanner currently detects this:
RSI indicator is oversold : under 30
Type : Neutral
Timeframe : Daily
CCI indicator is oversold : under -100
Type : Neutral
Timeframe : Daily
Williams %R indicator is oversold : under -80
Type : Neutral
Timeframe : Daily
Pivot points : price is under support 3
Type : Neutral
Timeframe : Daily
Pivot points : price is under support 3
Type : Neutral
Timeframe : Weekly
MACD crosses DOWN its Moving Average
Type : Bearish
Timeframe : Daily
Parabolic SAR indicator bearish reversal
Type : Bearish
Timeframe : Daily
An analysis of the price chart with the Central Patterns scanner (detector of chart patterns and resistances and supports) shows a result that can have an impact on the price change:
Support of channel is broken
Type : Bearish
Timeframe : Daily
The presence of a bearish pattern in Japanese candlesticks detected by Central Candlesticks that could cause a correction in the very short term was also detected:
Black evening star
Type : Bearish
Timeframe : Daily
| S2 | S1 | Price | R1 | R2 | R3 | |
|---|---|---|---|---|---|---|
| ProTrendLines | 84.91 | 122.17 | 130.53 | 179.57 | 194.94 | 226.09 |
| Change (%) | -34.95% | -6.40% | - | +37.57% | +49.34% | +73.21% |
| Change | -45.62 | -8.36 | - | +49.04 | +64.41 | +95.56 |
| Level | Minor | Intermediate | - | Intermediate | Intermediate | Intermediate |
To determine price objectives, it is also possible to use the pivot points. Here is the price position in relation to pivot points:
| Pivot points | S3 | S2 | S1 | PP | R1 | R2 | R3 |
|---|---|---|---|---|---|---|---|
| Standard | 166.48 | 168.51 | 172.15 | 174.18 | 177.82 | 179.85 | 183.49 |
| Camarilla | 174.24 | 174.76 | 175.28 | 175.80 | 176.32 | 176.84 | 177.36 |
| Woodie | 167.30 | 168.91 | 172.97 | 174.58 | 178.64 | 180.25 | 184.31 |
| Fibonacci | 168.51 | 170.67 | 172.01 | 174.18 | 176.34 | 177.68 | 179.85 |
| Pivot points | S3 | S2 | S1 | PP | R1 | R2 | R3 |
|---|---|---|---|---|---|---|---|
| Standard | 142.04 | 147.06 | 155.29 | 160.31 | 168.54 | 173.56 | 181.79 |
| Camarilla | 159.88 | 161.09 | 162.31 | 163.52 | 164.74 | 165.95 | 167.16 |
| Woodie | 143.65 | 147.86 | 156.90 | 161.11 | 170.15 | 174.36 | 183.40 |
| Fibonacci | 147.06 | 152.12 | 155.25 | 160.31 | 165.37 | 168.50 | 173.56 |
| Pivot points | S3 | S2 | S1 | PP | R1 | R2 | R3 |
|---|---|---|---|---|---|---|---|
| Standard | 106.63 | 129.35 | 150.65 | 173.37 | 194.67 | 217.39 | 238.69 |
| Camarilla | 159.84 | 163.87 | 167.91 | 171.94 | 175.98 | 180.01 | 184.05 |
| Woodie | 105.91 | 129.00 | 149.93 | 173.02 | 193.95 | 217.04 | 237.97 |
| Fibonacci | 129.35 | 146.17 | 156.56 | 173.37 | 190.19 | 200.58 | 217.39 |
Numerical data
The following is the status of technical indicators and moving averages registered at the time this technical analysis was created:
| RSI (14): | 25.99 | |
| MACD (12,26,9): | -9.2400 | |
| Directional Movement: | -30.48 | |
| AROON (14): | -100.00 | |
| DEMA (21): | 158.07 | |
| Parabolic SAR (0,02-0,02-0,2): | 176.20 | |
| Elder Ray (13): | -30.14 | |
| Super Trend (3,10): | 168.65 | |
| Zig ZAG (10): | 130.62 | |
| VORTEX (21): | 0.8200 | |
| Stochastique (14,3,5): | 37.05 | |
| TEMA (21): | 154.87 | |
| Williams %R (14): | -97.94 | |
| Chande Momentum Oscillator (20): | -48.16 | |
| Repulse (5,40,3): | -4.3000 | |
| ROCnROLL: | 2 | |
| TRIX (15,9): | -0.5600 | |
| Courbe Coppock: | 28.61 |
| MA7: | 159.26 | |
| MA20: | 172.52 | |
| MA50: | 182.27 | |
| MA100: | 215.13 | |
| MAexp7: | 158.71 | |
| MAexp20: | 169.51 | |
| MAexp50: | 185.52 | |
| MAexp100: | 207.13 | |
| Price / MA7: | -18.04% | |
| Price / MA20: | -24.34% | |
| Price / MA50: | -28.39% | |
| Price / MA100: | -39.33% | |
| Price / MAexp7: | -17.76% | |
| Price / MAexp20: | -23.00% | |
| Price / MAexp50: | -29.64% | |
| Price / MAexp100: | -36.98% |
News
The last news published on PAYPAL HOLDINGS INC. at the time of the generation of this analysis was as follows:
- PayPal Reports Fourth Quarter and Full Year 2021 Results
-
 PayPal Downside Appears Limited by FX Empire
- SoLa Impact's Black Impact Fund Receives $25 Million Investment from PayPal to Address Racial Equity Through Affordable Housing
- Venmo Launches Gift-Wrapping Feature to Help its Community Celebrate Every Moment
- PAYPAL ALERT: Bragar Eagel & Squire, P.C. is Investigating PayPal Holdings, Inc. on Behalf of Long-Term Stockholders and Encourages Investors to Contact the Firm
About author

Online


Add a comment
Comments
0 comments on the analysis PAYPAL HOLDINGS INC. - Daily