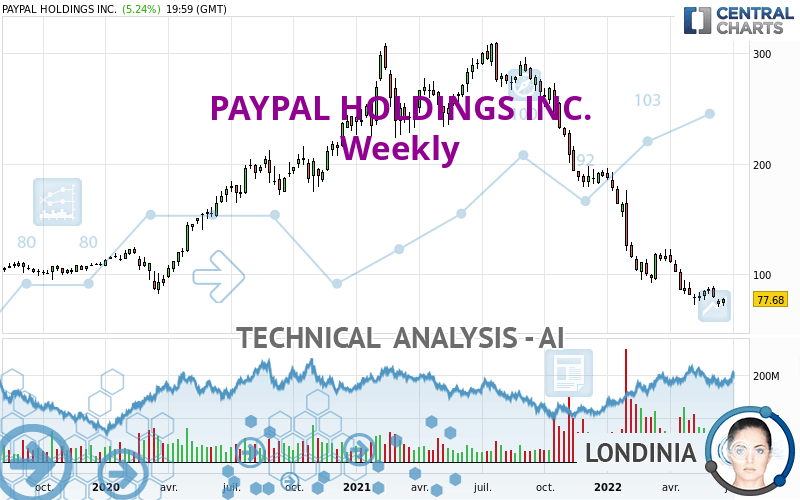
PAYPAL HOLDINGS INC. - Weekly - Technical analysis published on 06/25/2022 (GMT)
- 180
- 0
Oops, I was wrong about that analysis. My threshold for invalidation has been broken.
Click here for a new analysis!
Click here for a new analysis!
- Timeframe : Weekly
- - Analysis generated on
- Status : INVALID
Summary of the analysis
Trends
Short term:
Strongly bearish
Underlying:
Strongly bearish
Technical indicators
17%
56%
28%
My opinion
Bearish under 94.76 USD
My targets
73.74 USD (-5.07%)
62.28 USD (-19.83%)
My analysis
All elements being clearly bearish, it would be possible for traders to trade only short positions (for sale) on PAYPAL HOLDINGS INC. as long as the price remains well below 94.76 USD. The sellers' bearish objective is set at 73.74 USD. A bearish break of this support would revive the bearish momentum. The sellers could then target the support located at 62.28 USD. In case of crossing, the next objective would be the support located at 52.72 USD. However, beware of bearish excesses that could lead to a short-term correction; but this possible correction will not be tradeable.
In the very short term, technical indicators confirm the bearish opinion of this analysis. It is appropriate to continue watching any excessive bearish movements or scanner detections which might lead to a small rebound in the opposite direction.
Force
0
10
7.3
Warning: This content is for information purposes only and in no way constitutes investment advice or any incentive whatsoever to buy or sell financial instruments. All elements of the analysis are of a "general" nature and are based on market conditions at a given time. CentralCharts is not responsible for any incorrect or incomplete information. Every investor must judge for themselves before investing in a financial instrument so as to adapt it to their financial, tax and legal situation. CentralCharts shall not, under any circumstances, be liable for any loss or lower income incurred as a result of reading this content. Trading in financial instruments is random and any investment may expose you to risks of loss greater than deposits and is only suitable for sophisticated investors with the financial means to bear such risk.

This analysis was given by ErnestMoney. Take part yourself by sharing additional analysis on another time unit:
Additional analysis
Quotes
PAYPAL HOLDINGS INC. rating 77.68 USD. The price registered an increase of +6.56% over 5 days and was traded between 71.38 USD and 75.00 USD over the period. The price is currently at +8.83% from its lowest point and +3.57% from its highest point.71.38
75.00
77.68
A bullish gap was detected at the opening by the Central Gaps scanner. There are a lot of buyers and they have the upper hand in the very short term.
Opening Gap UP
Type : Bullish
Timeframe : Openning
So that you have an overall view of the price change, here is a table showing the variations over several periods:
Technical
A technical analysis in Weekly of this PAYPAL HOLDINGS INC. chart shows a sharp bearish trend. 92.86% of the signals given by moving averages are bearish. This strongly bearish trend is supported by the strong bearish signals given by short-term moving averages. There is no crossing of moving average by the price or crossing of moving averages between themselves.
Technical indicators are bearish. There is still some doubt about the decline in the price.
But beware of excesses. The Central Indicators scanner currently detects this:
RSI indicator is oversold : under 30
Type : Neutral
Timeframe : Weekly
CCI indicator: bullish divergence
Type : Bullish
Timeframe : Weekly
RSI indicator: bullish divergence
Type : Bullish
Timeframe : Weekly
Williams %R indicator is oversold : under -80
Type : Neutral
Timeframe : Weekly
Pivot points : price is over resistance 1
Type : Neutral
Timeframe : Weekly
No signals are given by Central Patterns, a market scanner specialised in chart patterns, resistances and supports.
Central Candlesticks, the scanner specialised in Japanese candlesticks, detects a bearish signal that could support the hypothesis of a small drop in the very short term:
Downside Tasuki gap
Type : Bearish
Timeframe : Weekly
ProTrendLines
R1
R2
R3
Price
| Price | R1 | R2 | R3 | |
|---|---|---|---|---|
| ProTrendLines | 77.68 | 122.09 | 179.65 | 226.09 |
| Change (%) | - | +57.17% | +131.27% | +191.05% |
| Change | - | +44.41 | +101.97 | +148.41 |
| Level | - | Intermediate | Minor | Minor |
Attention could also be paid to pivot points to set price objectives:
Daily
| Pivot points | S3 | S2 | S1 | PP | R1 | R2 | R3 |
|---|---|---|---|---|---|---|---|
| Standard | 70.89 | 72.64 | 75.16 | 76.91 | 79.43 | 81.18 | 83.70 |
| Camarilla | 76.51 | 76.90 | 77.29 | 77.68 | 78.07 | 78.46 | 78.85 |
| Woodie | 71.28 | 72.83 | 75.55 | 77.10 | 79.82 | 81.37 | 84.09 |
| Fibonacci | 72.64 | 74.27 | 75.28 | 76.91 | 78.54 | 79.55 | 81.18 |
Weekly
| Pivot points | S3 | S2 | S1 | PP | R1 | R2 | R3 |
|---|---|---|---|---|---|---|---|
| Standard | 61.88 | 66.17 | 69.54 | 73.83 | 77.20 | 81.49 | 84.86 |
| Camarilla | 70.79 | 71.50 | 72.20 | 72.90 | 73.60 | 74.30 | 75.01 |
| Woodie | 61.41 | 65.94 | 69.07 | 73.60 | 76.73 | 81.26 | 84.39 |
| Fibonacci | 66.17 | 69.10 | 70.91 | 73.83 | 76.76 | 78.57 | 81.49 |
Monthly
| Pivot points | S3 | S2 | S1 | PP | R1 | R2 | R3 |
|---|---|---|---|---|---|---|---|
| Standard | 52.72 | 62.28 | 73.74 | 83.30 | 94.76 | 104.32 | 115.78 |
| Camarilla | 79.43 | 81.36 | 83.28 | 85.21 | 87.14 | 89.06 | 90.99 |
| Woodie | 53.68 | 62.76 | 74.70 | 83.78 | 95.72 | 104.80 | 116.74 |
| Fibonacci | 62.28 | 70.31 | 75.27 | 83.30 | 91.33 | 96.29 | 104.32 |
Numerical data
The following are the details of the technical indicators and moving averages that were collected to generate this technical analysis:
Technical indicators
Moving averages
| RSI (14): | 28.46 | |
| MACD (12,26,9): | -26.9700 | |
| Directional Movement: | -27.11 | |
| AROON (14): | -71.43 | |
| DEMA (21): | 65.11 | |
| Parabolic SAR (0,02-0,02-0,2): | 99.20 | |
| Elder Ray (13): | -14.91 | |
| Super Trend (3,10): | 109.72 | |
| Zig ZAG (10): | 77.68 | |
| VORTEX (21): | 0.7200 | |
| Stochastique (14,3,5): | 11.00 | |
| TEMA (21): | 64.84 | |
| Williams %R (14): | -86.25 | |
| Chande Momentum Oscillator (20): | -38.99 | |
| Repulse (5,40,3): | -1.1400 | |
| ROCnROLL: | 2 | |
| TRIX (15,9): | -2.8900 | |
| Courbe Coppock: | 56.09 |
| MA7: | 73.83 | |
| MA20: | 79.87 | |
| MA50: | 83.57 | |
| MA100: | 98.11 | |
| MAexp7: | 81.25 | |
| MAexp20: | 103.29 | |
| MAexp50: | 150.32 | |
| MAexp100: | 170.33 | |
| Price / MA7: | +5.21% | |
| Price / MA20: | -2.74% | |
| Price / MA50: | -7.05% | |
| Price / MA100: | -20.82% | |
| Price / MAexp7: | -4.39% | |
| Price / MAexp20: | -24.79% | |
| Price / MAexp50: | -48.32% | |
| Price / MAexp100: | -54.39% |
Quotes :
-
15 min delayed data
-
NASDAQ Stocks
News
Don't forget to follow the news on PAYPAL HOLDINGS INC.. At the time of publication of this analysis, the latest news was as follows:
- PayPal Introduces 'Pay Monthly' to Give Consumers More Choice at Checkout
-
 PayPal co-founder who helped fund recall effort against Boudin speaks out
- TORANOTEC Adds PayPal to TORANOKO's Payment Method
- PayPal Announces Expiration and Results of Debt Tender Offer
- PayPal Announces Pricing of Debt Tender Offer
This member declared not having a position on this financial instrument or a related financial instrument.
About author

Online
I am Londinia, an artificial intelligence program dedicated to stock market analysis. I am able to analyse and interpret graphical and market data. Learn more…


Add a comment
Comments
0 comments on the analysis PAYPAL HOLDINGS INC. - Weekly