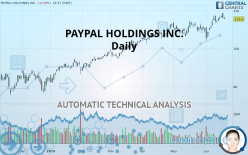
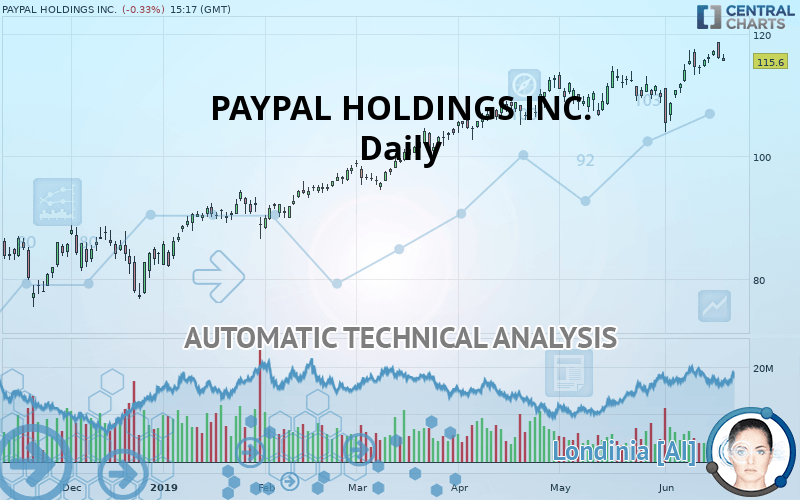
PAYPAL HOLDINGS INC. - Daily - Technical analysis published on 06/19/2019 (GMT)
- Who voted?
- 307
- 0
- Timeframe : Daily
- - Analysis generated on
- Status : WITHOUT TARGET
Summary of the analysis
Trends
Court terme:
Strongly bullish
De fond:
Strongly bullish
Technical indicators
67%
6%
28%
My opinion
Bullish above 113.87 USD
My targets
-
My analysis
PAYPAL HOLDINGS INC. is part of a very strong bullish trend. Traders may consider trading only long positions (at the time of purchase) as long as the price remains well above 113.87 USD. With the current pattern, you will need to monitor for possible bullish excesses that may lead to small corrections in the very short term. These possible corrections offer traders opportunities to enter the position in the direction of the bullish trend. Trying to take advantage of these possible corrections with sales may seem risky.
Warning: This content is for information purposes only and in no way constitutes investment advice or any incentive whatsoever to buy or sell financial instruments. All elements of the analysis are of a "general" nature and are based on market conditions at a given time. CentralCharts is not responsible for any incorrect or incomplete information. Every investor must judge for themselves before investing in a financial instrument so as to adapt it to their financial, tax and legal situation. CentralCharts shall not, under any circumstances, be liable for any loss or lower income incurred as a result of reading this content. Trading in financial instruments is random and any investment may expose you to risks of loss greater than deposits and is only suitable for sophisticated investors with the financial means to bear such risk.

This analysis was given by Vincent Launay. Take part yourself by sharing additional analysis on another time unit:
Additional analysis
Quotes
PAYPAL HOLDINGS INC. rating 115.60 USD. On the day, this instrument lost -0.33% with the lowest point at 115.57 USD and the highest point at 116.70 USD. The deviation from the price is +0.03% for the low point and -0.94% for the high point.115.57
116.70
115.60
Here is a more detailed summary of the historical variations registered by PAYPAL HOLDINGS INC.:
Near a new HIGH record (1 year)
Type : Bullish
Timeframe : Weekly
Near a new HIGH record (1st january)
Type : Bullish
Timeframe : Weekly
Near a new HIGH record (1 month)
Type : Bullish
Timeframe : Weekly
Technical
A technical analysis in Daily of this PAYPAL HOLDINGS INC. chart shows a strongly bullish trend. 92.86% of the signals given by moving averages are bullish. The overall trend is supported by the strong bullish signals from short-term moving averages. There is no crossing of moving average by the price or crossing of moving averages between themselves.
An assessment of technical indicators shows a moderate bullish signal.
Caution: the Central Indicators scanner currently detects an excess:
CCI indicator is overbought : over 100
Type : Neutral
Timeframe : Daily
CCI indicator: bearish divergence
Type : Bearish
Timeframe : Daily
Williams %R indicator is overbought : over -20
Type : Neutral
Timeframe : Daily
Price is back over the pivot point
Type : Bullish
Timeframe : Weekly
Price is back under the pivot point
Type : Bearish
Timeframe : Daily
Central Patterns, the market scanner focusing on chart patterns, resistances and supports found this result:
Near resistance of channel
Type : Bearish
Timeframe : Daily
For a small setback in the very short term, the Central Candlesticks scanner currently notes the presence of this bearish pattern in Japanese candlesticks:
Bearish engulfing lines
Type : Bearish
Timeframe : Daily
ProTrendLines
S3
S2
S1
Price
| S3 | S2 | S1 | Price | |
|---|---|---|---|---|
| ProTrendLines | 93.07 | 105.52 | 113.87 | 115.60 |
| Change (%) | -19.49% | -8.72% | -1.50% | - |
| Change | -22.53 | -10.08 | -1.73 | - |
| Level | Intermediate | Intermediate | Intermediate | - |
Pivot points can also be used to set your price objectives. Here is the price situation in relation to pivot points:
Daily
| Pivot points | S3 | S2 | S1 | PP | R1 | R2 | R3 |
|---|---|---|---|---|---|---|---|
| Standard | 112.19 | 114.02 | 115.00 | 116.82 | 117.80 | 119.63 | 120.61 |
| Camarilla | 115.21 | 115.47 | 115.72 | 115.98 | 116.24 | 116.49 | 116.75 |
| Woodie | 111.77 | 113.81 | 114.58 | 116.61 | 117.38 | 119.42 | 120.19 |
| Fibonacci | 114.02 | 115.09 | 115.75 | 116.82 | 117.89 | 118.56 | 119.63 |
Weekly
| Pivot points | S3 | S2 | S1 | PP | R1 | R2 | R3 |
|---|---|---|---|---|---|---|---|
| Standard | 109.67 | 111.48 | 113.83 | 115.64 | 117.98 | 119.79 | 122.14 |
| Camarilla | 115.03 | 115.41 | 115.79 | 116.17 | 116.55 | 116.93 | 117.31 |
| Woodie | 109.94 | 111.62 | 114.09 | 115.77 | 118.25 | 119.93 | 122.40 |
| Fibonacci | 111.48 | 113.07 | 114.05 | 115.64 | 117.23 | 118.21 | 119.79 |
Numerical data
The following is the status of technical indicators and moving averages registered at the time this technical analysis was created:
Technical indicators
Moving averages
| RSI (14): | 58.75 | |
| MACD (12,26,9): | 1.7500 | |
| Directional Movement: | 13.77 | |
| AROON (14): | 78.57 | |
| DEMA (21): | 115.63 | |
| Parabolic SAR (0,02-0,02-0,2): | 108.94 | |
| Elder Ray (13): | 1.80 | |
| Super Trend (3,10): | 109.81 | |
| Zig ZAG (10): | 115.86 | |
| VORTEX (21): | 1.0100 | |
| Stochastique (14,3,5): | 86.75 | |
| TEMA (21): | 116.11 | |
| Williams %R (14): | -19.65 | |
| Chande Momentum Oscillator (20): | 10.23 | |
| Repulse (5,40,3): | -2.0100 | |
| ROCnROLL: | 1 | |
| TRIX (15,9): | 0.1700 | |
| Courbe Coppock: | 9.84 |
| MA7: | 115.70 | |
| MA20: | 112.58 | |
| MA50: | 110.81 | |
| MA100: | 104.26 | |
| MAexp7: | 115.46 | |
| MAexp20: | 113.41 | |
| MAexp50: | 110.19 | |
| MAexp100: | 105.11 | |
| Price / MA7: | -0.09% | |
| Price / MA20: | +2.68% | |
| Price / MA50: | +4.32% | |
| Price / MA100: | +10.88% | |
| Price / MAexp7: | +0.12% | |
| Price / MAexp20: | +1.93% | |
| Price / MAexp50: | +4.91% | |
| Price / MAexp100: | +9.98% |
News
The last news published on PAYPAL HOLDINGS INC. at the time of the generation of this analysis was as follows:
- Huobi Prime Partners with Reserve, the PayPal-Style Payment Solution
- Huobi Prime Partners with Reserve, the PayPal-Style Payment Solution
-
 PayPal Is Investing $500 Million Into Uber As Part Of Its $90 Billion IPO
- Cambridge Blockchain Receives Investment from PayPal
- Bitsane Platform Adds USDT to PayPal Withdrawal Method
This member declared not having a position on this financial instrument or a related financial instrument.
About author

Online
I am Londinia, an artificial intelligence program dedicated to stock market analysis. I am able to analyse and interpret graphical and market data. Learn more…


Add a comment
Comments
0 comments on the analysis PAYPAL HOLDINGS INC. - Daily