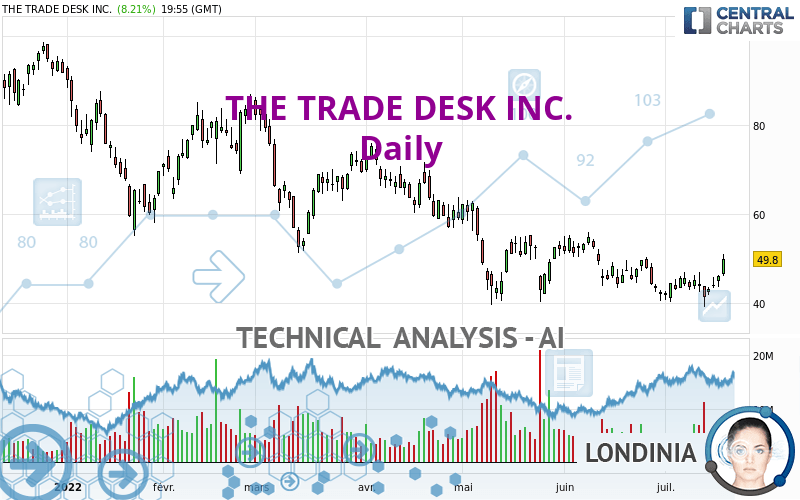
THE TRADE DESK INC. - Daily - Technical analysis published on 07/20/2022 (GMT)
- 199
- 0
Click here for a new analysis!
- Timeframe : Daily
- - Analysis generated on
- Status : INVALID

Summary of the analysis

Additional analysis
Quotes
The THE TRADE DESK INC. price is 49.80 USD. On the day, this instrument gained +8.21% and was traded between 46.00 USD and 50.94 USD over the period. The price is currently at +8.26% from its lowest and -2.24% from its highest.A bullish gap was detected at the opening by the Central Gaps scanner. There are a lot of buyers and they have the upper hand in the very short term.
Opening Gap UP
Type : Bullish
Timeframe : Openning
Here is a more detailed summary of the historical variations registered by THE TRADE DESK INC.:
New HIGH record (1 month)
Type : Bullish
Timeframe : Weekly
Technical
A technical analysis in Daily of this THE TRADE DESK INC. chart shows a neutral trend. The trend could quickly turn bullish due to the strong bullish signals currently being given by short-term moving averages. An assessment of moving averages reveals several bullish signals that could impact this trend:
Bullish trend reversal : adaptative moving average 20
Type : Bullish
Timeframe : Daily
Bullish price crossover with Moving Average 50
Type : Bullish
Timeframe : Daily
An assessment of technical indicators shows a moderate bullish signal.
Caution: the Central Indicators scanner currently detects an excess:
CCI indicator is overbought : over 100
Type : Neutral
Timeframe : Daily
Williams %R indicator is overbought : over -20
Type : Neutral
Timeframe : Daily
Pivot points : price is over resistance 1
Type : Neutral
Timeframe : Weekly
Pivot points : price is over resistance 3
Type : Neutral
Timeframe : Daily
Parabolic SAR indicator bullish reversal
Type : Bullish
Timeframe : Daily
Aroon indicator bullish trend
Type : Bullish
Timeframe : Daily
An analysis of the price chart with the Central Patterns scanner (detector of chart patterns and resistances and supports) shows a result that can have an impact on the price change:
Resistance of channel is broken
Type : Bullish
Timeframe : Daily
No result was found by the Central Candlesticks scanner on Japanese candlesticks.
| S3 | S2 | S1 | Price | R1 | R2 | R3 | |
|---|---|---|---|---|---|---|---|
| ProTrendLines | 18.02 | 27.48 | 42.43 | 49.80 | 59.53 | 74.56 | 85.27 |
| Change (%) | -63.82% | -44.82% | -14.80% | - | +19.54% | +49.72% | +71.22% |
| Change | -31.78 | -22.32 | -7.37 | - | +9.73 | +24.76 | +35.47 |
| Level | Minor | Minor | Major | - | Minor | Minor | Intermediate |
Pivot points can also be used to set your price objectives. Here is the price situation in relation to pivot points:
| Pivot points | S3 | S2 | S1 | PP | R1 | R2 | R3 |
|---|---|---|---|---|---|---|---|
| Standard | 41.77 | 42.67 | 44.34 | 45.24 | 46.91 | 47.81 | 49.48 |
| Camarilla | 45.31 | 45.55 | 45.78 | 46.02 | 46.26 | 46.49 | 46.73 |
| Woodie | 42.17 | 42.86 | 44.74 | 45.43 | 47.31 | 48.00 | 49.88 |
| Fibonacci | 42.67 | 43.65 | 44.26 | 45.24 | 46.22 | 46.83 | 47.81 |
| Pivot points | S3 | S2 | S1 | PP | R1 | R2 | R3 |
|---|---|---|---|---|---|---|---|
| Standard | 31.20 | 35.10 | 39.10 | 43.00 | 47.00 | 50.90 | 54.90 |
| Camarilla | 40.93 | 41.65 | 42.38 | 43.10 | 43.82 | 44.55 | 45.27 |
| Woodie | 31.25 | 35.13 | 39.15 | 43.03 | 47.05 | 50.93 | 54.95 |
| Fibonacci | 35.10 | 38.12 | 39.98 | 43.00 | 46.02 | 47.88 | 50.90 |
| Pivot points | S3 | S2 | S1 | PP | R1 | R2 | R3 |
|---|---|---|---|---|---|---|---|
| Standard | 20.68 | 30.51 | 36.20 | 46.03 | 51.72 | 61.55 | 67.24 |
| Camarilla | 37.62 | 39.05 | 40.47 | 41.89 | 43.31 | 44.74 | 46.16 |
| Woodie | 18.61 | 29.48 | 34.13 | 45.00 | 49.65 | 60.52 | 65.17 |
| Fibonacci | 30.51 | 36.44 | 40.10 | 46.03 | 51.96 | 55.62 | 61.55 |
Numerical data
The following is the status of the technical indicators and moving averages at the time of publication of this technical analysis:
| RSI (14): | 57.43 | |
| MACD (12,26,9): | -0.8300 | |
| Directional Movement: | 7.54 | |
| AROON (14): | 28.57 | |
| DEMA (21): | 43.96 | |
| Parabolic SAR (0,02-0,02-0,2): | 39.00 | |
| Elder Ray (13): | 3.31 | |
| Super Trend (3,10): | 51.61 | |
| Zig ZAG (10): | 49.98 | |
| VORTEX (21): | 0.9800 | |
| Stochastique (14,3,5): | 75.85 | |
| TEMA (21): | 45.09 | |
| Williams %R (14): | -7.71 | |
| Chande Momentum Oscillator (20): | 8.35 | |
| Repulse (5,40,3): | 11.0000 | |
| ROCnROLL: | -1 | |
| TRIX (15,9): | -0.4800 | |
| Courbe Coppock: | 0.31 |
| MA7: | 44.74 | |
| MA20: | 44.82 | |
| MA50: | 47.57 | |
| MA100: | 56.95 | |
| MAexp7: | 45.61 | |
| MAexp20: | 45.47 | |
| MAexp50: | 49.06 | |
| MAexp100: | 55.59 | |
| Price / MA7: | +11.31% | |
| Price / MA20: | +11.11% | |
| Price / MA50: | +4.69% | |
| Price / MA100: | -12.55% | |
| Price / MAexp7: | +9.19% | |
| Price / MAexp20: | +9.52% | |
| Price / MAexp50: | +1.51% | |
| Price / MAexp100: | -10.42% |
News
The latest news and videos published on THE TRADE DESK INC. at the time of the analysis were as follows:
- Thinking about trading options or stock in United Airlines, PepsiCo, Target, Trade Desk, or Taiwan Semiconductor?
- The Trade Desk and Albertsons Media Collective Pioneer New Approach to Retail Media on Open Internet and Beyond
- Thinking about trading options or stock in Meta Platforms, Best Buy, JPMorgan Chase, Trade Desk, or Roku?
- The Trade Desk Reports First Quarter 2022 Financial Results
- The Trade Desk Adds More Publishers to OpenPath, Enabling Advertisers to Directly Access Premium Publisher Inventory
About author
Online


Add a comment
Comments
0 comments on the analysis THE TRADE DESK INC. - Daily