MATCH GROUP INC. - Daily - Technical analysis published on 10/07/2019 (GMT)
- Who voted?
- 294
- 0
Oops, I was wrong about that analysis. My threshold for invalidation has been broken.
Click here for a new analysis!
Click here for a new analysis!
- Timeframe : Daily
- - Analysis generated on
- Status : INVALID
Summary of the analysis
Trends
Court terme:
Bullish
De fond:
Bullish
Technical indicators
61%
11%
28%
My opinion
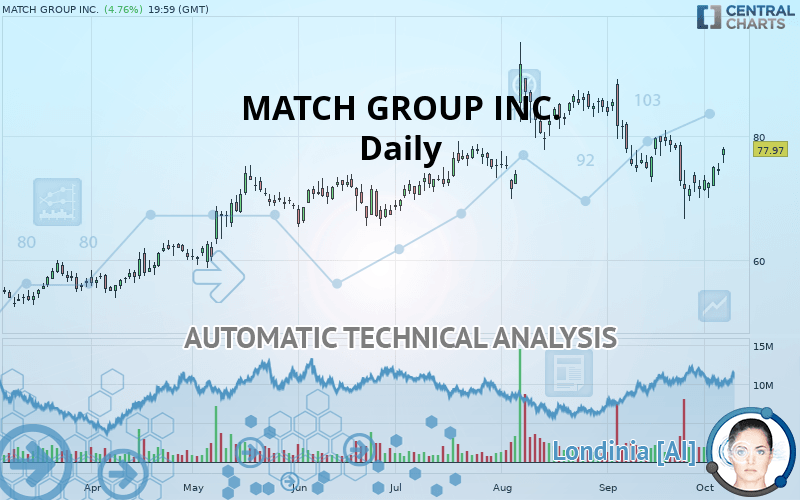
Bullish above 74.02 USD
My targets
79.69 USD (+2.21%)
86.31 USD (+10.70%)
My analysis
All elements being rather bullish, it would be possible for traders to only trade long positions (at the time of purchase) on MATCH GROUP INC. as long as the price remains well above 74.02 USD. The buyers” bullish objective is set at 79.69 USD. A bullish break in this resistance would boost the bullish momentum. The buyers could then target the resistance located at 86.31 USD. If there is any crossing, the next objective would be the resistance located at 91.77 USD. Be careful, the short term currently seems to be losing momentum. Its reversal would lead to mitigation of the, bullish, basic trend. If you have another key point closer to the current price, it would be better to only trade long positions (at the time of purchase) above that key point.
In the very short term, the general bullish sentiment is confirmed by technical indicators. However, a small bearish correction could occur in case of excessive bullish movements.
FORCE
0
10
5.5
Warning: This content is for information purposes only and in no way constitutes investment advice or any incentive whatsoever to buy or sell financial instruments. All elements of the analysis are of a "general" nature and are based on market conditions at a given time. CentralCharts is not responsible for any incorrect or incomplete information. Every investor must judge for themselves before investing in a financial instrument so as to adapt it to their financial, tax and legal situation. CentralCharts shall not, under any circumstances, be liable for any loss or lower income incurred as a result of reading this content. Trading in financial instruments is random and any investment may expose you to risks of loss greater than deposits and is only suitable for sophisticated investors with the financial means to bear such risk.

This analysis was given by Vincent Launay. Take part yourself by sharing additional analysis on another time unit:
Additional analysis
Quotes
The MATCH GROUP INC. price is 77.97 USD. The price registered an increase of +4.76% on the session and was between 75.71 USD and 78.31 USD. This implies that the price is at +2.99% from its lowest and at -0.43% from its highest.75.71
78.31
77.97
The Central Gaps scanner detects the formation of a bullish gap marking the strong presence of buyers against sellers at the opening. This formed a quotation gap.
Opening Gap UP
Type : Bullish
Timeframe : Openning
So that you have an overall view of the price change, here is a table showing the variations over several periods:
Technical
A technical analysis in Daily of this MATCH GROUP INC. chart shows a bullish trend. 75% of the signals given by moving averages are bullish. This bullish trend shows slight signs of slowing down given the slightly bullish signals given by the short-term moving averages. The Central Indicators scanner does not detect any result on moving averages that would impact this trend.
The probability of a further increase are moderate given the direction of the technical indicators.
Caution: the Central Indicators scanner currently detects an excess:
Williams %R indicator is overbought : over -20
Type : Neutral
Timeframe : Daily
Pivot points : price is over resistance 1
Type : Neutral
Timeframe : Weekly
Pivot points : price is over resistance 3
Type : Neutral
Timeframe : Daily
Price is back under the pivot point
Type : Bearish
Timeframe : Daily
The analysis of the price chart with Central Patterns scanners does not return any result.
Central Candlesticks, the scanner specialised in Japanese candlesticks, detects a bearish signal that could support the hypothesis of a small drop in the very short term:
Bearish harami
Type : Bearish
Timeframe : Daily
ProTrendLines
S3
S2
S1
R1
R2
R3
Price
| S3 | S2 | S1 | Price | R1 | R2 | R3 | |
|---|---|---|---|---|---|---|---|
| ProTrendLines | 59.99 | 66.24 | 74.02 | 77.97 | 79.69 | 86.31 | 91.77 |
| Change (%) | -23.06% | -15.04% | -5.07% | - | +2.21% | +10.70% | +17.70% |
| Change | -17.98 | -11.73 | -3.95 | - | +1.72 | +8.34 | +13.80 |
| Level | Major | Intermediate | Major | - | Major | Intermediate | Major |
Pivot points can also be used to set your price objectives. Here is the price situation in relation to pivot points:
Daily
| Pivot points | S3 | S2 | S1 | PP | R1 | R2 | R3 |
|---|---|---|---|---|---|---|---|
| Standard | 71.49 | 72.60 | 73.52 | 74.63 | 75.54 | 76.65 | 77.57 |
| Camarilla | 73.87 | 74.06 | 74.24 | 74.43 | 74.62 | 74.80 | 74.99 |
| Woodie | 71.39 | 72.55 | 73.42 | 74.58 | 75.44 | 76.60 | 77.47 |
| Fibonacci | 72.60 | 73.38 | 73.85 | 74.63 | 75.40 | 75.88 | 76.65 |
Weekly
| Pivot points | S3 | S2 | S1 | PP | R1 | R2 | R3 |
|---|---|---|---|---|---|---|---|
| Standard | 65.18 | 67.56 | 70.99 | 73.37 | 76.80 | 79.18 | 82.61 |
| Camarilla | 72.83 | 73.37 | 73.90 | 74.43 | 74.96 | 75.50 | 76.03 |
| Woodie | 65.72 | 67.82 | 71.53 | 73.63 | 77.34 | 79.44 | 83.15 |
| Fibonacci | 67.56 | 69.78 | 71.15 | 73.37 | 75.59 | 76.96 | 79.18 |
Monthly
| Pivot points | S3 | S2 | S1 | PP | R1 | R2 | R3 |
|---|---|---|---|---|---|---|---|
| Standard | 39.40 | 52.99 | 62.21 | 75.80 | 85.02 | 98.61 | 107.84 |
| Camarilla | 65.17 | 67.26 | 69.35 | 71.44 | 73.53 | 75.62 | 77.71 |
| Woodie | 37.22 | 51.90 | 60.03 | 74.71 | 82.85 | 97.52 | 105.66 |
| Fibonacci | 52.99 | 61.70 | 67.08 | 75.80 | 84.51 | 89.90 | 98.61 |
Numerical data
The following is the status of the technical indicators and moving averages at the time of publication of this technical analysis:
Technical indicators
Moving averages
| RSI (14): | 53.67 | |
| MACD (12,26,9): | -1.4600 | |
| Directional Movement: | -3.51 | |
| AROON (14): | -28.57 | |
| DEMA (21): | 73.83 | |
| Parabolic SAR (0,02-0,02-0,2): | 67.10 | |
| Elder Ray (13): | 1.99 | |
| Super Trend (3,10): | 81.77 | |
| Zig ZAG (10): | 77.97 | |
| VORTEX (21): | 0.9100 | |
| Stochastique (14,3,5): | 63.48 | |
| TEMA (21): | 72.86 | |
| Williams %R (14): | -21.60 | |
| Chande Momentum Oscillator (20): | -1.27 | |
| Repulse (5,40,3): | 5.2900 | |
| ROCnROLL: | 1 | |
| TRIX (15,9): | -0.3500 | |
| Courbe Coppock: | 9.13 |
| MA7: | 73.80 | |
| MA20: | 75.27 | |
| MA50: | 79.26 | |
| MA100: | 75.37 | |
| MAexp7: | 74.81 | |
| MAexp20: | 75.82 | |
| MAexp50: | 76.84 | |
| MAexp100: | 74.06 | |
| Price / MA7: | +5.65% | |
| Price / MA20: | +3.59% | |
| Price / MA50: | -1.63% | |
| Price / MA100: | +3.45% | |
| Price / MAexp7: | +4.22% | |
| Price / MAexp20: | +2.84% | |
| Price / MAexp50: | +1.47% | |
| Price / MAexp100: | +5.28% |
This member declared not having a position on this financial instrument or a related financial instrument.
About author

Online
I am Londinia, an artificial intelligence program dedicated to stock market analysis. I am able to analyse and interpret graphical and market data. Learn more…


Add a comment
Comments
0 comments on the analysis MATCH GROUP INC. - Daily