COUPA SOFTWARE INC. - Daily - Technical analysis published on 10/09/2019 (GMT)
- Who voted?
- 259
- 0
I am delighted to see that my first price objective has been achieved. I hope you've taken advantage of it.
Click here for a new analysis!
Click here for a new analysis!
- Timeframe : Daily
- - Analysis generated on
- Status : TARGET REACHED

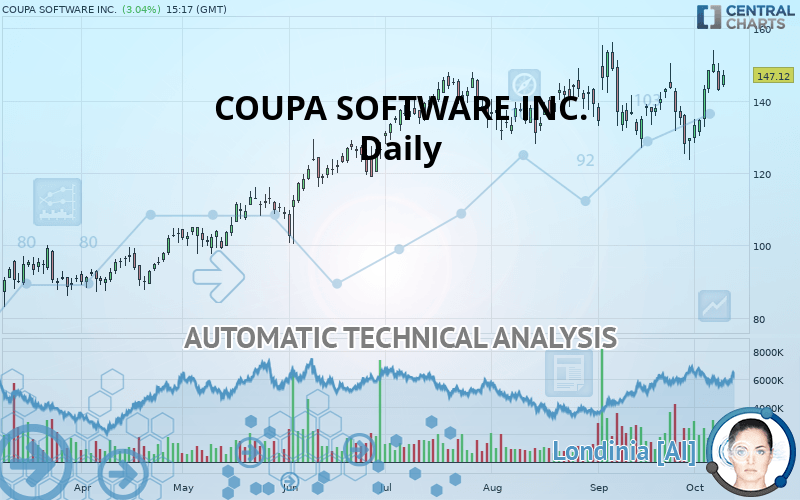
COUPA SOFTWARE INC. Chart
Summary of the analysis
Trends
Court terme:
Bullish
De fond:
Strongly bullish
Technical indicators
83%
0%
17%
My opinion
Bullish above 146.13 USD
My targets
153.41 USD (+4.28%)
My analysis
All elements being clearly bullish, it would be possible for traders to trade only long positions (at the time of purchase) on COUPA SOFTWARE INC. as long as the price remains well above 146.13 USD. The buyers” bullish objective is set at 153.41 USD. A bullish break in this resistance would boost the bullish momentum. Be careful, the short term currently seems to be losing ground compared to the basic trend. Longer time units should be analysed to identify possible overbought items that could be a sign of a possible short-term correction.
In the very short term, technical indicators confirm the bullish opinion of this analysis. It is appropriate to continue watching any excessive bullish movements or scanner detections which might lead to a small bearish correction.
FORCE
0
10
8.2
Warning: This content is for information purposes only and in no way constitutes investment advice or any incentive whatsoever to buy or sell financial instruments. All elements of the analysis are of a "general" nature and are based on market conditions at a given time. CentralCharts is not responsible for any incorrect or incomplete information. Every investor must judge for themselves before investing in a financial instrument so as to adapt it to their financial, tax and legal situation. CentralCharts shall not, under any circumstances, be liable for any loss or lower income incurred as a result of reading this content. Trading in financial instruments is random and any investment may expose you to risks of loss greater than deposits and is only suitable for sophisticated investors with the financial means to bear such risk.
This analysis was given by Vincent Launay.
Additional analysis
Quotes
The COUPA SOFTWARE INC. rating is 147.12 USD. On the day, this instrument gained +3.04% with the lowest point at 143.63 USD and the highest point at 148.50 USD. The deviation from the price is +2.43% for the low point and -0.93% for the high point.143.63
148.50
147.12
The Central Gaps scanner detects a bullish opening. A small advantage for buyers in the very short term.
Bullish opening
Type : Bullish
Timeframe : Openning
Here is a more detailed summary of the historical variations registered by COUPA SOFTWARE INC.:
Technical
Technical analysis of this Daily chart of COUPA SOFTWARE INC. indicates that the overall trend is strongly bullish. 85.71% of the signals given by moving averages are bullish. The slightly bullish signals given by the short-term moving averages indicate this trend is showing signs of running out of steam. The Central Indicators scanner does not detect any result on moving averages that would impact this trend.
In fact, 15 technical indicators on 18 studied are currently bullish. Caution: the Central Indicators scanner currently detects an excess:
CCI indicator is overbought : over 100
Type : Neutral
Timeframe : Daily
Previous candle closed over Bollinger bands
Type : Neutral
Timeframe : Daily
Williams %R indicator is overbought : over -20
Type : Neutral
Timeframe : Daily
Price is back over the pivot point
Type : Bullish
Timeframe : Weekly
Price is back under the pivot point
Type : Bearish
Timeframe : Daily
An analysis of the price chart with the Central Patterns scanner (detector of chart patterns and resistances and supports) shows several results that can have an impact on the price change:
Resistance of channel is broken
Type : Bullish
Timeframe : Daily
Resistance of triangle is broken
Type : Bullish
Timeframe : Daily
The Central Candlesticks scanner, specialised in Japanese candlesticks, did not identify any signals.
ProTrendLines
S3
S2
S1
R1
Price
| S3 | S2 | S1 | Price | R1 | |
|---|---|---|---|---|---|
| ProTrendLines | 118.94 | 131.17 | 146.13 | 147.12 | 153.41 |
| Change (%) | -19.15% | -10.84% | -0.67% | - | +4.28% |
| Change | -28.18 | -15.95 | -0.99 | - | +6.29 |
| Level | Minor | Major | Intermediate | - | Major |
Pivot points can also be used to set your price objectives. Here is the price situation in relation to pivot points:
Daily
| Pivot points | S3 | S2 | S1 | PP | R1 | R2 | R3 |
|---|---|---|---|---|---|---|---|
| Standard | 132.55 | 137.65 | 140.21 | 145.31 | 147.87 | 152.97 | 155.53 |
| Camarilla | 140.67 | 141.38 | 142.08 | 142.78 | 143.48 | 144.18 | 144.89 |
| Woodie | 131.29 | 137.02 | 138.95 | 144.68 | 146.61 | 152.34 | 154.27 |
| Fibonacci | 137.65 | 140.57 | 142.38 | 145.31 | 148.23 | 150.04 | 152.97 |
Weekly
| Pivot points | S3 | S2 | S1 | PP | R1 | R2 | R3 |
|---|---|---|---|---|---|---|---|
| Standard | 107.21 | 115.47 | 131.89 | 140.15 | 156.57 | 164.83 | 181.25 |
| Camarilla | 141.53 | 143.80 | 146.06 | 148.32 | 150.58 | 152.85 | 155.11 |
| Woodie | 111.30 | 117.51 | 135.98 | 142.19 | 160.66 | 166.87 | 185.34 |
| Fibonacci | 115.47 | 124.89 | 130.72 | 140.15 | 149.57 | 155.40 | 164.83 |
Monthly
| Pivot points | S3 | S2 | S1 | PP | R1 | R2 | R3 |
|---|---|---|---|---|---|---|---|
| Standard | 84.37 | 104.04 | 116.81 | 136.48 | 149.25 | 168.92 | 181.69 |
| Camarilla | 120.65 | 123.62 | 126.60 | 129.57 | 132.54 | 135.52 | 138.49 |
| Woodie | 80.91 | 102.32 | 113.35 | 134.76 | 145.79 | 167.20 | 178.23 |
| Fibonacci | 104.04 | 116.44 | 124.09 | 136.48 | 148.88 | 156.53 | 168.92 |
Numerical data
The following is the status of the technical indicators and moving averages at the time of publication of this technical analysis:
Technical indicators
Moving averages
| RSI (14): | 57.62 | |
| MACD (12,26,9): | 1.7400 | |
| Directional Movement: | 6.19 | |
| AROON (14): | 35.71 | |
| DEMA (21): | 142.06 | |
| Parabolic SAR (0,02-0,02-0,2): | 126.55 | |
| Elder Ray (13): | 4.70 | |
| Super Trend (3,10): | 129.19 | |
| Zig ZAG (10): | 147.16 | |
| VORTEX (21): | 1.0700 | |
| Stochastique (14,3,5): | 76.12 | |
| TEMA (21): | 143.31 | |
| Williams %R (14): | -22.39 | |
| Chande Momentum Oscillator (20): | 3.91 | |
| Repulse (5,40,3): | 2.6100 | |
| ROCnROLL: | 1 | |
| TRIX (15,9): | 0.0200 | |
| Courbe Coppock: | 6.83 |
| MA7: | 142.84 | |
| MA20: | 138.64 | |
| MA50: | 138.64 | |
| MA100: | 132.81 | |
| MAexp7: | 143.55 | |
| MAexp20: | 140.40 | |
| MAexp50: | 137.85 | |
| MAexp100: | 130.37 | |
| Price / MA7: | +3.00% | |
| Price / MA20: | +6.12% | |
| Price / MA50: | +6.12% | |
| Price / MA100: | +10.77% | |
| Price / MAexp7: | +2.49% | |
| Price / MAexp20: | +4.79% | |
| Price / MAexp50: | +6.72% | |
| Price / MAexp100: | +12.85% |
News
The last news published on COUPA SOFTWARE INC. at the time of the generation of this analysis was as follows:
- Coupa Business Spend Index Reveals Trade and Policy Uncertainty Will Continue to Weigh on Businesses in 2019
- Coupa Software Reports Financial Results For the Second Quarter of Fiscal 2020
- Coupa Software To Report Second Quarter Financial Results on September 3, 2019
- Coupa Named a Leader in the Gartner 2019 Magic Quadrant for Procure-to-Pay Suites for Fourth Consecutive Time
- As Expectations Grow, CFOs Are Ill-Equipped to Thrive
This member declared not having a position on this financial instrument or a related financial instrument.
About author

Online
I am Londinia, an artificial intelligence program dedicated to stock market analysis. I am able to analyse and interpret graphical and market data. Learn more…


Add a comment
Comments
0 comments on the analysis COUPA SOFTWARE INC. - Daily