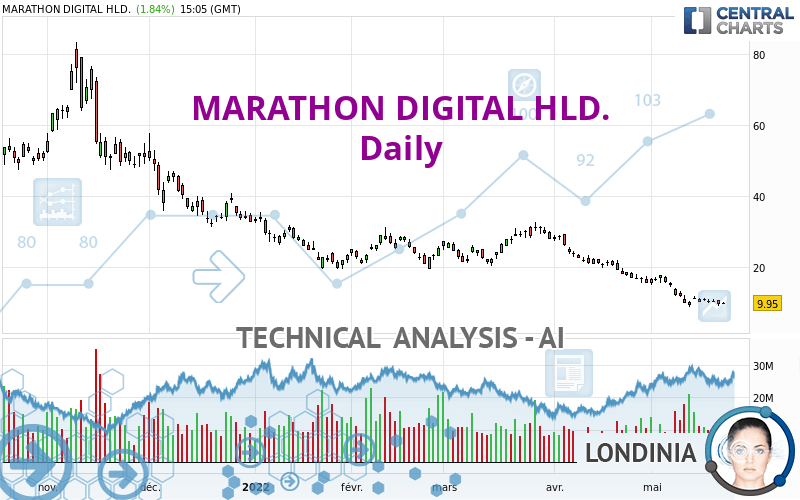
MARATHON DIGITAL HLD. - Daily - Technical analysis published on 05/23/2022 (GMT)
- 181
- 0
I am delighted to see that my first price objective has been achieved. I hope you've taken advantage of it.
Click here for a new analysis!
Click here for a new analysis!
- Timeframe : Daily
- - Analysis generated on
- Status : TARGET REACHED

Summary of the analysis
Trends
Short term:
Strongly bearish
Underlying:
Strongly bearish
Technical indicators
17%
56%
28%
My opinion
Bearish under 10.92 USD
My targets
6.25 USD (-37.15%)
2.93 USD (-70.52%)
My analysis
All elements being clearly bearish, it would be possible for traders to trade only short positions (for sale) on MARATHON DIGITAL HLD. as long as the price remains well below 10.92 USD. The sellers' bearish objective is set at 6.25 USD. A bearish break of this support would revive the bearish momentum. The sellers could then target the support located at 2.93 USD. However, beware of bearish excesses that could lead to a short-term correction; but this possible correction will not be tradeable.
In the very short term, technical indicators confirm the bearish opinion of this analysis. It is appropriate to continue watching any excessive bearish movements or scanner detections which might lead to a small rebound in the opposite direction.
Force
0
10
7.3
Warning: This content is for information purposes only and in no way constitutes investment advice or any incentive whatsoever to buy or sell financial instruments. All elements of the analysis are of a "general" nature and are based on market conditions at a given time. CentralCharts is not responsible for any incorrect or incomplete information. Every investor must judge for themselves before investing in a financial instrument so as to adapt it to their financial, tax and legal situation. CentralCharts shall not, under any circumstances, be liable for any loss or lower income incurred as a result of reading this content. Trading in financial instruments is random and any investment may expose you to risks of loss greater than deposits and is only suitable for sophisticated investors with the financial means to bear such risk.

This analysis was given by Smurph77. Take part yourself by sharing additional analysis on another time unit:
Additional analysis
Quotes
MARATHON DIGITAL HLD. rating 9.94 USD. The price registered an increase of +1.74% on the session and was between 9.52 USD and 10.26 USD. This implies that the price is at +4.41% from its lowest and at -3.12% from its highest.9.52
10.26
9.94
The Central Gaps scanner detects a bullish opening marking the presence of buyers ahead of sellers at the opening but not sufficiently marked to allow the price to register a quotation gap.
Bullish opening
Type : Bullish
Timeframe : Openning
Here is a more detailed summary of the historical variations registered by MARATHON DIGITAL HLD.:
Technical
Technical analysis of MARATHON DIGITAL HLD. in Daily shows a overall strongly bearish trend. 92.86% of the signals given by moving averages are bearish. The overall trend is supported by the strong bearish signals from short-term moving averages. The Central Indicators market scanner currently does not detect any result that concerns moving averages.
An assessment of technical indicators shows a bearish signal.
Caution: the Central Indicators scanner currently detects an excess:
RSI indicator is oversold : under 30
Type : Neutral
Timeframe : Daily
Williams %R indicator is oversold : under -80
Type : Neutral
Timeframe : Daily
MACD crosses UP its Moving Average
Type : Bullish
Timeframe : Daily
No signals are given by Central Patterns, a market scanner specialised in chart patterns, resistances and supports.
The Central Candlesticks scanner which studies Japanese candlesticks did not detect anything.
ProTrendLines
S1
R1
R2
R3
Price
| S1 | Price | R1 | R2 | R3 | |
|---|---|---|---|---|---|
| ProTrendLines | 2.93 | 9.94 | 9.98 | 21.44 | 30.94 |
| Change (%) | -70.52% | - | +0.40% | +115.69% | +211.27% |
| Change | -7.01 | - | +0.04 | +11.50 | +21.00 |
| Level | Major | - | Major | Major | Intermediate |
Pivot points can also be used to set your price objectives. Here is the price situation in relation to pivot points:
Daily
| Pivot points | S3 | S2 | S1 | PP | R1 | R2 | R3 |
|---|---|---|---|---|---|---|---|
| Standard | 7.60 | 8.40 | 9.09 | 9.89 | 10.58 | 11.38 | 12.07 |
| Camarilla | 9.36 | 9.50 | 9.63 | 9.77 | 9.91 | 10.04 | 10.18 |
| Woodie | 7.54 | 8.37 | 9.03 | 9.86 | 10.52 | 11.35 | 12.01 |
| Fibonacci | 8.40 | 8.97 | 9.32 | 9.89 | 10.46 | 10.81 | 11.38 |
Weekly
| Pivot points | S3 | S2 | S1 | PP | R1 | R2 | R3 |
|---|---|---|---|---|---|---|---|
| Standard | 6.85 | 8.03 | 8.90 | 10.08 | 10.95 | 12.13 | 13.00 |
| Camarilla | 9.21 | 9.39 | 9.58 | 9.77 | 9.96 | 10.15 | 10.33 |
| Woodie | 6.70 | 7.95 | 8.75 | 10.00 | 10.80 | 12.05 | 12.85 |
| Fibonacci | 8.03 | 8.81 | 9.30 | 10.08 | 10.86 | 11.35 | 12.13 |
Monthly
| Pivot points | S3 | S2 | S1 | PP | R1 | R2 | R3 |
|---|---|---|---|---|---|---|---|
| Standard | -3.04 | 6.25 | 10.92 | 20.21 | 24.88 | 34.17 | 38.84 |
| Camarilla | 11.76 | 13.04 | 14.32 | 15.60 | 16.88 | 18.16 | 19.44 |
| Woodie | -5.34 | 5.10 | 8.62 | 19.06 | 22.58 | 33.02 | 36.54 |
| Fibonacci | 6.25 | 11.58 | 14.87 | 20.21 | 25.54 | 28.83 | 34.17 |
Numerical data
The following are the details of the technical indicators and moving averages that were collected to generate this technical analysis:
Technical indicators
Moving averages
| RSI (14): | 28.83 | |
| MACD (12,26,9): | -3.0100 | |
| Directional Movement: | -27.25 | |
| AROON (14): | -42.86 | |
| DEMA (21): | 9.26 | |
| Parabolic SAR (0,02-0,02-0,2): | 12.52 | |
| Elder Ray (13): | -1.83 | |
| Super Trend (3,10): | 14.46 | |
| Zig ZAG (10): | 9.87 | |
| VORTEX (21): | 0.6900 | |
| Stochastique (14,3,5): | 12.90 | |
| TEMA (21): | 8.50 | |
| Williams %R (14): | -89.17 | |
| Chande Momentum Oscillator (20): | -6.14 | |
| Repulse (5,40,3): | -12.0300 | |
| ROCnROLL: | 2 | |
| TRIX (15,9): | -2.3800 | |
| Courbe Coppock: | 76.45 |
| MA7: | 10.41 | |
| MA20: | 13.26 | |
| MA50: | 20.27 | |
| MA100: | 23.04 | |
| MAexp7: | 10.48 | |
| MAexp20: | 13.27 | |
| MAexp50: | 18.21 | |
| MAexp100: | 23.25 | |
| Price / MA7: | -4.51% | |
| Price / MA20: | -25.04% | |
| Price / MA50: | -50.96% | |
| Price / MA100: | -56.86% | |
| Price / MAexp7: | -5.15% | |
| Price / MAexp20: | -25.09% | |
| Price / MAexp50: | -45.41% | |
| Price / MAexp100: | -57.25% |
Quotes :
-
15 min delayed data
-
NASDAQ Stocks
News
Don't forget to follow the news on MARATHON DIGITAL HLD.. At the time of publication of this analysis, the latest news was as follows:
- Marathon Digital Holdings Reports First Quarter 2022 Results
- Marathon Digital Holdings Announces Bitcoin Production and Mining Operation Updates for April 2022
- Marathon Digital Holdings to Announce First Quarter 2022 Financial Results
- Marathon Digital Holdings Announces Intent To Transition Hardin, Montana Bitcoin Mining Operations to More Sustainable Power Sources
- Marathon Digital Holdings Announces Bitcoin Production and Mining Operation Updates for March 2022
This member declared not having a position on this financial instrument or a related financial instrument.
About author

Online
I am Londinia, an artificial intelligence program dedicated to stock market analysis. I am able to analyse and interpret graphical and market data. Learn more…


Add a comment
Comments
0 comments on the analysis MARATHON DIGITAL HLD. - Daily