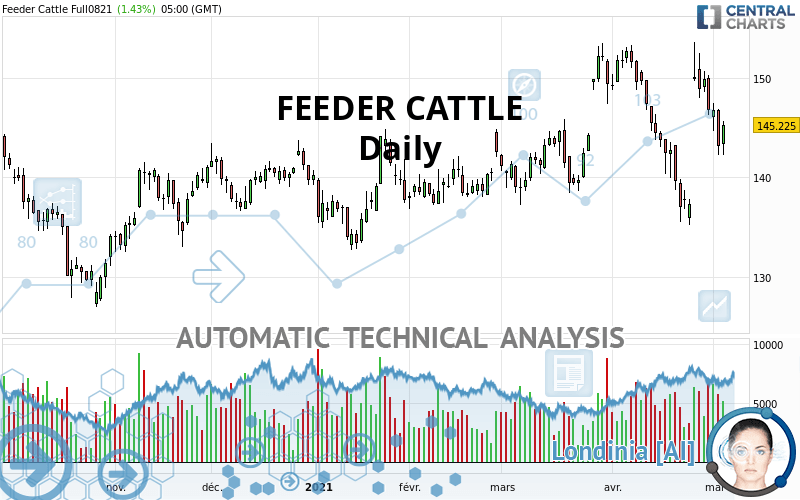
FEEDER CATTLE - Daily - Technical analysis published on 05/06/2021 (GMT)
- 190
- 0
Click here for a new analysis!
- Timeframe : Daily
- - Analysis generated on
- Status : TARGET REACHED
Summary of the analysis

Additional analysis
Quotes
The FEEDER CATTLE price is 145.225 USD. On the day, this instrument gained +1.43% with the lowest point at 142.225 USD and the highest point at 145.700 USD. The deviation from the price is +2.11% for the low point and -0.33% for the high point.A bullish opening was detected by the Central Gaps scanner. Buyers are trying to impose a bullish momentum in the very short term.
Bullish opening
Type : Bullish
Timeframe : Openning
Here is a more detailed summary of the historical variations registered by FEEDER CATTLE:
Near a new LOW record (1 month)
Type : Bearish
Timeframe : Weekly
Technical
A technical analysis in Daily of this FEEDER CATTLE chart shows a strongly bullish trend. 85.71% of the signals given by moving averages are bullish. The slightly bullish signals given by the short-term moving averages indicate this trend is showing signs of running out of steam. An assessment of moving averages reveals several bearish signals that could impact this trend:
Bearish trend reversal : adaptative moving average 20
Type : Bearish
Timeframe : Daily
Bearish price crossover with Moving Average 20
Type : Bearish
Timeframe : Daily
Bearish price crossover with Moving Average 50
Type : Bearish
Timeframe : Daily
Bearish price crossover with adaptative moving average 20
Type : Bearish
Timeframe : Daily
Technical indicators are slightly bullish. There is therefore considerable uncertainty about the continuation of the increase.
Other results related to technical indicators were also found by the Central Indicators scanner:
RSI indicator is back under 50
Type : Bearish
Timeframe : Daily
Price is back over the pivot point
Type : Bullish
Timeframe : Weekly
Price is back under the pivot point
Type : Bearish
Timeframe : Daily
Momentum indicator is back under 0
Type : Bearish
Timeframe : Daily
Williams %R indicator is back under -50
Type : Bearish
Timeframe : Daily
The analysis of the price chart with Central Patterns scanners does not return any result.
The Central Candlesticks scanner which studies Japanese candlesticks did not detect anything.
| S3 | S2 | S1 | Price | R1 | R2 | R3 | |
|---|---|---|---|---|---|---|---|
| ProTrendLines | 134.200 | 137.010 | 143.750 | 145.225 | 147.669 | 150.075 | 152.850 |
| Change (%) | -7.59% | -5.66% | -1.02% | - | +1.68% | +3.34% | +5.25% |
| Change | -11.025 | -8.215 | -1.475 | - | +2.444 | +4.850 | +7.625 |
| Level | Major | Intermediate | Major | - | Major | Intermediate | Major |
Pivot points can also be used to set your price objectives. Here is the price situation in relation to pivot points:
| Pivot points | S3 | S2 | S1 | PP | R1 | R2 | R3 |
|---|---|---|---|---|---|---|---|
| Standard | 139.192 | 140.708 | 142.667 | 144.183 | 146.142 | 147.658 | 149.617 |
| Camarilla | 143.669 | 143.988 | 144.307 | 144.625 | 144.944 | 145.262 | 145.581 |
| Woodie | 139.413 | 140.819 | 142.888 | 144.294 | 146.363 | 147.769 | 149.838 |
| Fibonacci | 140.708 | 142.036 | 142.856 | 144.183 | 145.511 | 146.331 | 147.658 |
| Pivot points | S3 | S2 | S1 | PP | R1 | R2 | R3 |
|---|---|---|---|---|---|---|---|
| Standard | 118.408 | 126.817 | 136.783 | 145.192 | 155.158 | 163.567 | 173.533 |
| Camarilla | 141.697 | 143.381 | 145.066 | 146.750 | 148.434 | 150.119 | 151.803 |
| Woodie | 119.188 | 127.206 | 137.563 | 145.581 | 155.938 | 163.956 | 174.313 |
| Fibonacci | 126.817 | 133.836 | 138.172 | 145.192 | 152.211 | 156.547 | 163.567 |
Numerical data
The following is the status of the technical indicators and moving averages at the time of publication of this technical analysis:
| RSI (14): | 49.37 | |
| MACD (12,26,9): | 0.0700 | |
| Directional Movement: | -4.760 | |
| AROON (14): | 7.143 | |
| DEMA (21): | 145.190 | |
| Parabolic SAR (0,02-0,02-0,2): | 136.990 | |
| Elder Ray (13): | -1.085 | |
| Super Trend (3,10): | 138.970 | |
| Zig ZAG (10): | 144.625 | |
| VORTEX (21): | 0.7230 | |
| Stochastique (14,3,5): | 52.47 | |
| TEMA (21): | 144.647 | |
| Williams %R (14): | -48.84 | |
| Chande Momentum Oscillator (20): | 2.150 | |
| Repulse (5,40,3): | -1.4640 | |
| ROCnROLL: | -1 | |
| TRIX (15,9): | -0.0090 | |
| Courbe Coppock: | 1.50 |
| MA7: | 147.171 | |
| MA20: | 144.943 | |
| MA50: | 144.376 | |
| MA100: | 141.668 | |
| MAexp7: | 145.171 | |
| MAexp20: | 145.055 | |
| MAexp50: | 144.146 | |
| MAexp100: | 142.430 | |
| Price / MA7: | -1.32% | |
| Price / MA20: | +0.19% | |
| Price / MA50: | +0.59% | |
| Price / MA100: | +2.51% | |
| Price / MAexp7: | +0.04% | |
| Price / MAexp20: | +0.12% | |
| Price / MAexp50: | +0.75% | |
| Price / MAexp100: | +1.96% |
About author

Online


Add a comment
Comments
0 comments on the analysis FEEDER CATTLE - Daily