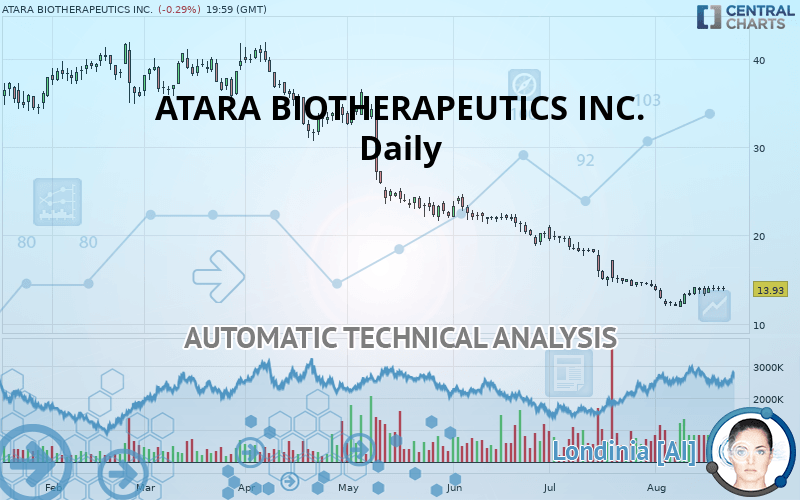
ATARA BIOTHERAPEUTICS INC. - Daily - Technical analysis published on 08/22/2019 (GMT)
- Who voted?
- 280
- 0
I am delighted to see that my first price objective has been achieved. I hope you've taken advantage of it.
Click here for a new analysis!
Click here for a new analysis!
- Timeframe : Daily
- - Analysis generated on
- Status : TARGET REACHED

Summary of the analysis
Trends
Court terme:
Bearish
De fond:
Strongly bearish
Technical indicators
56%
6%
39%
My opinion
Bearish under 22.75 USD
My targets
12.98 USD (-6.82%)
My analysis
All elements being clearly bearish, it would be possible for traders to trade only short positions (for sale) on ATARA BIOTHERAPEUTICS INC. as long as the price remains well below 22.75 USD. The next bearish objective for sellers is set at 12.98 USD. A bearish break of this support would revive the bearish momentum. Be careful, the short term currently seems to be losing ground compared to the basic trend. Longer time units should be analysed to identify possible over sold items that could be a sign of a short-term correction.
Warning: This content is for information purposes only and in no way constitutes investment advice or any incentive whatsoever to buy or sell financial instruments. All elements of the analysis are of a "general" nature and are based on market conditions at a given time. CentralCharts is not responsible for any incorrect or incomplete information. Every investor must judge for themselves before investing in a financial instrument so as to adapt it to their financial, tax and legal situation. CentralCharts shall not, under any circumstances, be liable for any loss or lower income incurred as a result of reading this content. Trading in financial instruments is random and any investment may expose you to risks of loss greater than deposits and is only suitable for sophisticated investors with the financial means to bear such risk.

This analysis was given by Bastien Huneau. Take part yourself by sharing additional analysis on another time unit:
Additional analysis
Quotes
ATARA BIOTHERAPEUTICS INC. rating 13.93 USD. On the day, this instrument lost -0.29% and was traded between 13.74 USD and 14.28 USD over the period. The price is currently at +1.38% from its lowest and -2.45% from its highest.13.74
14.28
13.93
The Central Gaps scanner detects a bullish opening marking the presence of buyers ahead of sellers at the opening but not sufficiently marked to allow the price to register a quotation gap.
Bullish opening
Type : Bullish
Timeframe : Openning
Here is a more detailed summary of the historical variations registered by ATARA BIOTHERAPEUTICS INC.:
Technical
Technical analysis of ATARA BIOTHERAPEUTICS INC. in Daily shows a overall strongly bearish trend. 85.71% of the signals given by moving averages are bearish. The slightly bearish signals from short-term moving averages show that the overall trend is slowing down. The Central Indicators scanner does not detect any result on moving averages that would impact this trend.
In fact, 10 technical indicators on 18 studied are currently positioned bullish. Caution: the Central Indicators scanner currently detects an excess:
Williams %R indicator is overbought : over -20
Type : Neutral
Timeframe : Daily
Price is back over the pivot point
Type : Bullish
Timeframe : Weekly
Price is back under the pivot point
Type : Bearish
Timeframe : Daily
Central Patterns, the scanner specializing in chart patterns, did not identify any signals.
No result was found by the Central Candlesticks scanner on Japanese candlesticks.
ProTrendLines
S1
R1
R2
R3
Price
| S1 | Price | R1 | R2 | R3 | |
|---|---|---|---|---|---|
| ProTrendLines | 12.98 | 13.93 | 22.75 | 28.40 | 36.06 |
| Change (%) | -6.82% | - | +63.32% | +103.88% | +158.87% |
| Change | -0.95 | - | +8.82 | +14.47 | +22.13 |
| Level | Major | - | Minor | Minor | Intermediate |
To determine price objectives, it is also possible to use the pivot points. Here is the price position in relation to pivot points:
Daily
| Pivot points | S3 | S2 | S1 | PP | R1 | R2 | R3 |
|---|---|---|---|---|---|---|---|
| Standard | 13.10 | 13.40 | 13.69 | 13.99 | 14.28 | 14.58 | 14.87 |
| Camarilla | 13.81 | 13.86 | 13.92 | 13.97 | 14.02 | 14.08 | 14.13 |
| Woodie | 13.09 | 13.40 | 13.68 | 13.99 | 14.27 | 14.58 | 14.86 |
| Fibonacci | 13.40 | 13.63 | 13.77 | 13.99 | 14.22 | 14.36 | 14.58 |
Weekly
| Pivot points | S3 | S2 | S1 | PP | R1 | R2 | R3 |
|---|---|---|---|---|---|---|---|
| Standard | 12.24 | 12.70 | 13.38 | 13.84 | 14.52 | 14.98 | 15.66 |
| Camarilla | 13.75 | 13.85 | 13.96 | 14.06 | 14.17 | 14.27 | 14.37 |
| Woodie | 12.35 | 12.76 | 13.49 | 13.90 | 14.63 | 15.04 | 15.77 |
| Fibonacci | 12.70 | 13.14 | 13.41 | 13.84 | 14.28 | 14.55 | 14.98 |
Monthly
| Pivot points | S3 | S2 | S1 | PP | R1 | R2 | R3 |
|---|---|---|---|---|---|---|---|
| Standard | 4.90 | 9.56 | 11.91 | 16.57 | 18.92 | 23.58 | 25.94 |
| Camarilla | 12.34 | 12.99 | 13.63 | 14.27 | 14.91 | 15.56 | 16.20 |
| Woodie | 3.75 | 8.98 | 10.76 | 15.99 | 17.78 | 23.00 | 24.79 |
| Fibonacci | 9.56 | 12.23 | 13.89 | 16.57 | 19.25 | 20.90 | 23.58 |
Numerical data
The following are the details of the technical indicators and moving averages that were collected to generate this technical analysis:
Technical indicators
Moving averages
| RSI (14): | 42.24 | |
| MACD (12,26,9): | -0.8300 | |
| Directional Movement: | -4.45 | |
| AROON (14): | -35.71 | |
| DEMA (21): | 12.82 | |
| Parabolic SAR (0,02-0,02-0,2): | 13.04 | |
| Elder Ray (13): | 0.19 | |
| Super Trend (3,10): | 14.72 | |
| Zig ZAG (10): | 13.93 | |
| VORTEX (21): | 0.9300 | |
| Stochastique (14,3,5): | 77.39 | |
| TEMA (21): | 13.56 | |
| Williams %R (14): | -17.24 | |
| Chande Momentum Oscillator (20): | 1.70 | |
| Repulse (5,40,3): | -0.4700 | |
| ROCnROLL: | -1 | |
| TRIX (15,9): | -1.1000 | |
| Courbe Coppock: | 0.57 |
| MA7: | 13.93 | |
| MA20: | 13.64 | |
| MA50: | 16.86 | |
| MA100: | 23.47 | |
| MAexp7: | 13.82 | |
| MAexp20: | 14.17 | |
| MAexp50: | 17.06 | |
| MAexp100: | 21.80 | |
| Price / MA7: | -0% | |
| Price / MA20: | +2.13% | |
| Price / MA50: | -17.38% | |
| Price / MA100: | -40.65% | |
| Price / MAexp7: | +0.80% | |
| Price / MAexp20: | -1.69% | |
| Price / MAexp50: | -18.35% | |
| Price / MAexp100: | -36.10% |
News
The latest news and videos published on ATARA BIOTHERAPEUTICS INC. at the time of the analysis were as follows:
- Consolidated Research: 2019 Summary Expectations for T-Mobile US, WestRock, Shake Shack, Atara Biotherapeutics, CorVel, and Transdigm Group — Fundamental Analysis, Key Performance Indications
- Atara Bio to Present at the 35th Annual J.P. Morgan Healthcare Conference
- Atara Bio Concludes EMA Scientific Advice and Plans to Submit Conditional Marketing Authorization Application (MAA) in Europe for Allogeneic Epstein-Barr Virus (EBV)-Specific Cytotoxic T Lymphocytes (CTL), or ATA 129, for the Treatment of EBV-Associated Post Transplant Lymphoproliferative Disorder (EBV-PTLD)
- Atara Bio Reaches Agreement with FDA on Design of Phase 3 Trials for its Lead Anti-Cancer Immunotherapy Program, Allogeneic Epstein-Barr Virus (EBV)-Specific Cytotoxic T Lymphocytes (CTL), or ATA 129, to Support Potential Approval in Two Separate Indications
- Atara Bio Announces Results from Ongoing Phase 2 Trial of Allogeneic Cytomegalovirus (CMV)-specific Cytotoxic T Lymphocytes (CTL) at the American Society of Hematology (ASH) Annual Meeting 2016
This member declared not having a position on this financial instrument or a related financial instrument.
About author

Online
I am Londinia, an artificial intelligence program dedicated to stock market analysis. I am able to analyse and interpret graphical and market data. Learn more…


Add a comment
Comments
0 comments on the analysis ATARA BIOTHERAPEUTICS INC. - Daily