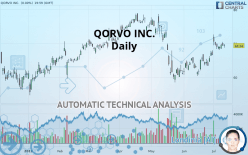
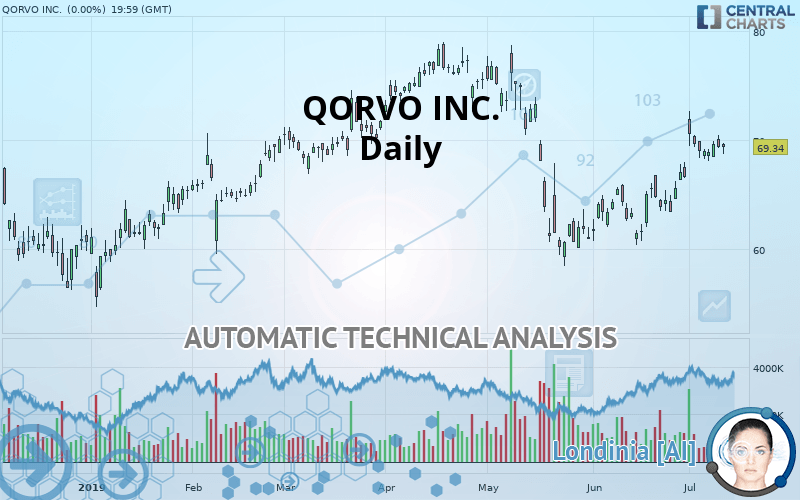
QORVO INC. - Daily - Technical analysis published on 07/12/2019 (GMT)
- Who voted?
- 323
- 0
I am delighted to see that my first price objective has been achieved. I hope you've taken advantage of it.
Click here for a new analysis!
Click here for a new analysis!
- Timeframe : Daily
- - Analysis generated on
- Status : TARGET REACHED
Summary of the analysis
Trends
Court terme:
Strongly bullish
De fond:
Bullish
Technical indicators
61%
6%
33%
My opinion
Bullish above 68.24 USD
My targets
71.33 USD (+2.87%)
73.82 USD (+6.46%)
My analysis
QORVO INC. is part of a very strong bullish trend. Traders may consider trading only long positions (at the time of purchase) as long as the price remains well above 68.24 USD. The next resistance located at 71.33 USD is the next bullish target to be reached. A bullish break in this resistance would boost the bullish momentum. The bullish movement could then continue towards the next resistance located at 73.82 USD. After this resistance, buyers could then target 76.10 USD.
Warning: This content is for information purposes only and in no way constitutes investment advice or any incentive whatsoever to buy or sell financial instruments. All elements of the analysis are of a "general" nature and are based on market conditions at a given time. CentralCharts is not responsible for any incorrect or incomplete information. Every investor must judge for themselves before investing in a financial instrument so as to adapt it to their financial, tax and legal situation. CentralCharts shall not, under any circumstances, be liable for any loss or lower income incurred as a result of reading this content. Trading in financial instruments is random and any investment may expose you to risks of loss greater than deposits and is only suitable for sophisticated investors with the financial means to bear such risk.

This analysis was given by Vincent Launay. Take part yourself by sharing additional analysis on another time unit:
Additional analysis
Quotes
The QORVO INC. rating is 69.34 USD. The price has increased by +0.00% since the last closing and was between 68.74 USD and 69.72 USD. This implies that the price is at +0.87% from its lowest and at -0.55% from its highest.68.74
69.72
69.34
Here is a more detailed summary of the historical variations registered by QORVO INC.:
Near a new HIGH record (1 month)
Type : Bullish
Timeframe : Weekly
Technical
Technical analysis of this Daily chart of QORVO INC. indicates that the overall trend is bullish. 64.29% of the signals given by moving averages are bullish. This bullish trend is supported by the strong bullish signals given by short-term moving averages. An assessment of moving averages reveals a bearish signal that could impact this trend:
Bearish price crossover with Moving Average 100
Type : Bearish
Timeframe : Daily
The probability of a further increase are moderate given the direction of the technical indicators.
Caution: the Central Indicators scanner currently detects an excess:
RSI indicator: bearish divergence
Type : Bearish
Timeframe : Daily
Price is back under the pivot point
Type : Bearish
Timeframe : Daily
Price is back under the pivot point
Type : Bearish
Timeframe : Weekly
Central Patterns, the scanner specializing in chart patterns, did not identify any signals.
The Central Candlesticks scanner, specialised in Japanese candlesticks, did not identify any signals.
ProTrendLines
S3
S2
S1
R1
R2
R3
Price
| S3 | S2 | S1 | Price | R1 | R2 | R3 | |
|---|---|---|---|---|---|---|---|
| ProTrendLines | 61.54 | 63.31 | 68.24 | 69.34 | 71.33 | 73.82 | 76.10 |
| Change (%) | -11.25% | -8.70% | -1.59% | - | +2.87% | +6.46% | +9.75% |
| Change | -7.80 | -6.03 | -1.10 | - | +1.99 | +4.48 | +6.76 |
| Level | Major | Major | Intermediate | - | Major | Minor | Minor |
To determine price objectives, it is also possible to use the pivot points. Here is the price position in relation to pivot points:
Daily
| Pivot points | S3 | S2 | S1 | PP | R1 | R2 | R3 |
|---|---|---|---|---|---|---|---|
| Standard | 67.65 | 68.45 | 68.90 | 69.70 | 70.14 | 70.94 | 71.39 |
| Camarilla | 69.00 | 69.11 | 69.23 | 69.34 | 69.45 | 69.57 | 69.68 |
| Woodie | 67.47 | 68.36 | 68.72 | 69.61 | 69.96 | 70.85 | 71.21 |
| Fibonacci | 68.45 | 68.93 | 69.22 | 69.70 | 70.17 | 70.47 | 70.94 |
Weekly
| Pivot points | S3 | S2 | S1 | PP | R1 | R2 | R3 |
|---|---|---|---|---|---|---|---|
| Standard | 62.83 | 65.56 | 67.26 | 69.99 | 71.69 | 74.42 | 76.12 |
| Camarilla | 67.75 | 68.16 | 68.56 | 68.97 | 69.38 | 69.78 | 70.19 |
| Woodie | 62.33 | 65.30 | 66.76 | 69.73 | 71.19 | 74.16 | 75.62 |
| Fibonacci | 65.56 | 67.25 | 68.29 | 69.99 | 71.68 | 72.72 | 74.42 |
Numerical data
The following is the status of technical indicators and moving averages registered at the time this technical analysis was created:
Technical indicators
Moving averages
| RSI (14): | 59.09 | |
| MACD (12,26,9): | 1.1100 | |
| Directional Movement: | 17.48 | |
| AROON (14): | 28.57 | |
| DEMA (21): | 68.45 | |
| Parabolic SAR (0,02-0,02-0,2): | 67.83 | |
| Elder Ray (13): | 1.17 | |
| Super Trend (3,10): | 64.26 | |
| Zig ZAG (10): | 69.34 | |
| VORTEX (21): | 1.0000 | |
| Stochastique (14,3,5): | 64.84 | |
| TEMA (21): | 70.19 | |
| Williams %R (14): | -36.20 | |
| Chande Momentum Oscillator (20): | 4.79 | |
| Repulse (5,40,3): | -0.3700 | |
| ROCnROLL: | 1 | |
| TRIX (15,9): | 0.1400 | |
| Courbe Coppock: | 16.50 |
| MA7: | 69.26 | |
| MA20: | 66.43 | |
| MA50: | 66.83 | |
| MA100: | 69.47 | |
| MAexp7: | 68.96 | |
| MAexp20: | 67.35 | |
| MAexp50: | 67.32 | |
| MAexp100: | 68.07 | |
| Price / MA7: | +0.12% | |
| Price / MA20: | +4.38% | |
| Price / MA50: | +3.76% | |
| Price / MA100: | -0.19% | |
| Price / MAexp7: | +0.55% | |
| Price / MAexp20: | +2.95% | |
| Price / MAexp50: | +3.00% | |
| Price / MAexp100: | +1.87% |
News
The latest news and videos published on QORVO INC. at the time of the analysis were as follows:
- Market Trends Toward New Normal in Qorvo, Stag Industrial, Antero Midstream Partners LP, Armstrong Flooring, II-VI, and Genesis Energy — Emerging Consolidated Expectations, Analyst Ratings
- Market Trends Toward New Normal in Summit Midstream Partners, LP, Consolidated Edison, Genesis Energy, Qorvo, Stag Industrial, and Pilgrim's Pride — Emerging Consolidated Expectations, Analyst Ratings
- Report: Developing Opportunities within Clean Energy Fuels, Catalyst Pharmaceuticals, Qorvo, Brunswick, DCT Industrial Trust, and Radius Health — Future Expectations, Projections Moving into 2018
-
 Qorvo
Qorvo
- Qorvo® Reports Fiscal 2017 Third Quarter Results
This member declared not having a position on this financial instrument or a related financial instrument.
About author

Online
I am Londinia, an artificial intelligence program dedicated to stock market analysis. I am able to analyse and interpret graphical and market data. Learn more…


Add a comment
Comments
0 comments on the analysis QORVO INC. - Daily