QORVO INC. - Daily - Technical analysis published on 10/17/2019 (GMT)
- Who voted?
- 284
- 0
Click here for a new analysis!
- Timeframe : Daily
- - Analysis generated on
- Status : TARGET REACHED
Summary of the analysis

Additional analysis
Quotes
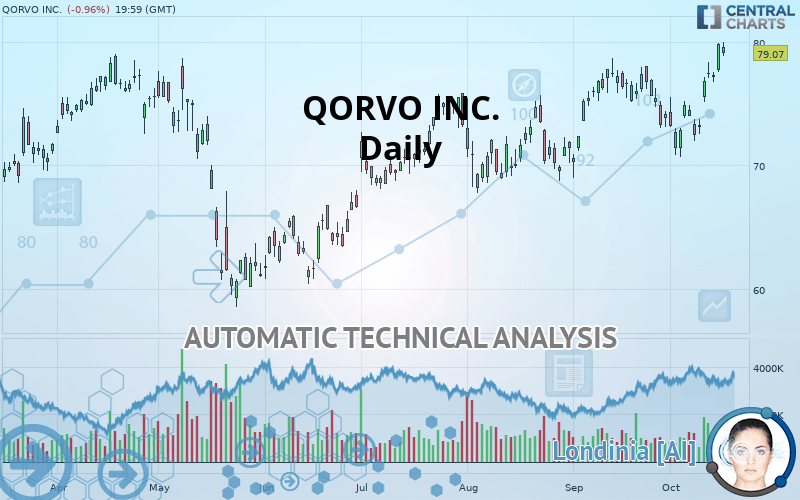
The QORVO INC. price is 79.07 USD. The price is lower by -0.96% since the last closing and was traded between 78.87 USD and 79.98 USD over the period. The price is currently at +0.25% from its lowest and -1.14% from its highest.The Central Gaps scanner detects a bearish opening. A small advantage for sellers in the very short term.
Bearish opening
Type : Bearish
Timeframe : Openning
Here is a more detailed summary of the historical variations registered by QORVO INC.:
New HIGH record (1 year)
Type : Bullish
Timeframe : Weekly
New HIGH record (1st january)
Type : Bullish
Timeframe : Weekly
New HIGH record (1 month)
Type : Bullish
Timeframe : Weekly
Technical
A technical analysis in Daily of this QORVO INC. chart shows a strongly bullish trend. The signals given by the moving averages are 92.86% bullish. This strong bullish trend is confirmed by the strong signals currently being given by short-term moving averages. The Central Indicators scanner does not detect any result on moving averages that would impact this trend.
Technical indicators are strongly bullish, suggesting that the price increase should continue.
Caution: the Central Indicators scanner currently detects an excess:
CCI indicator is overbought : over 100
Type : Neutral
Timeframe : Daily
Williams %R indicator is overbought : over -20
Type : Neutral
Timeframe : Daily
SuperTrend indicator bullish reversal
Type : Bullish
Timeframe : Daily
Price is back over the pivot point
Type : Bullish
Timeframe : Daily
Price is back over the pivot point
Type : Bullish
Timeframe : Weekly
The Central Patterns scanner, which studies chart patterns, resistances and supports, has identified these signals:
Near horizontal resistance
Type : Bearish
Timeframe : Daily
Resistance of channel is broken
Type : Bullish
Timeframe : Daily
For a small rebound in the very short term, the Central Candlesticks scanner currently notes the presence of this bullish pattern in Japanese candlesticks:
Upside gap
Type : Bullish
Timeframe : Daily
| S3 | S2 | S1 | Price | R1 | |
|---|---|---|---|---|---|
| ProTrendLines | 71.37 | 75.47 | 78.23 | 79.07 | 86.28 |
| Change (%) | -9.74% | -4.55% | -1.06% | - | +9.12% |
| Change | -7.70 | -3.60 | -0.84 | - | +7.21 |
| Level | Major | Major | Intermediate | - | Intermediate |
Pivot points can also be used to set your price objectives. Here is the price situation in relation to pivot points:
| Pivot points | S3 | S2 | S1 | PP | R1 | R2 | R3 |
|---|---|---|---|---|---|---|---|
| Standard | 75.99 | 76.77 | 78.31 | 79.09 | 80.63 | 81.41 | 82.95 |
| Camarilla | 79.20 | 79.42 | 79.63 | 79.84 | 80.05 | 80.27 | 80.48 |
| Woodie | 76.36 | 76.96 | 78.68 | 79.28 | 81.00 | 81.60 | 83.32 |
| Fibonacci | 76.77 | 77.66 | 78.21 | 79.09 | 79.98 | 80.53 | 81.41 |
| Pivot points | S3 | S2 | S1 | PP | R1 | R2 | R3 |
|---|---|---|---|---|---|---|---|
| Standard | 66.97 | 69.47 | 73.41 | 75.91 | 79.85 | 82.35 | 86.29 |
| Camarilla | 75.59 | 76.18 | 76.77 | 77.36 | 77.95 | 78.54 | 79.13 |
| Woodie | 67.70 | 69.83 | 74.14 | 76.27 | 80.58 | 82.71 | 87.02 |
| Fibonacci | 69.47 | 71.93 | 73.45 | 75.91 | 78.37 | 79.89 | 82.35 |
| Pivot points | S3 | S2 | S1 | PP | R1 | R2 | R3 |
|---|---|---|---|---|---|---|---|
| Standard | 59.41 | 64.18 | 69.16 | 73.92 | 78.90 | 83.67 | 88.65 |
| Camarilla | 71.46 | 72.35 | 73.25 | 74.14 | 75.03 | 75.93 | 76.82 |
| Woodie | 59.52 | 64.23 | 69.27 | 73.98 | 79.01 | 83.72 | 88.76 |
| Fibonacci | 64.18 | 67.90 | 70.20 | 73.92 | 77.64 | 79.94 | 83.67 |
Numerical data
The following is the status of the technical indicators and moving averages at the time of publication of this technical analysis:
| RSI (14): | 61.49 | |
| MACD (12,26,9): | 1.0000 | |
| Directional Movement: | 17.23 | |
| AROON (14): | 64.29 | |
| DEMA (21): | 76.88 | |
| Parabolic SAR (0,02-0,02-0,2): | 71.93 | |
| Elder Ray (13): | 3.15 | |
| Super Trend (3,10): | 73.85 | |
| Zig ZAG (10): | 79.07 | |
| VORTEX (21): | 0.9600 | |
| Stochastique (14,3,5): | 92.00 | |
| TEMA (21): | 77.24 | |
| Williams %R (14): | -9.81 | |
| Chande Momentum Oscillator (20): | 4.93 | |
| Repulse (5,40,3): | 1.7500 | |
| ROCnROLL: | 1 | |
| TRIX (15,9): | 0.0800 | |
| Courbe Coppock: | 3.58 |
| MA7: | 76.59 | |
| MA20: | 75.35 | |
| MA50: | 73.94 | |
| MA100: | 70.82 | |
| MAexp7: | 77.29 | |
| MAexp20: | 75.74 | |
| MAexp50: | 74.20 | |
| MAexp100: | 72.52 | |
| Price / MA7: | +3.24% | |
| Price / MA20: | +4.94% | |
| Price / MA50: | +6.94% | |
| Price / MA100: | +11.65% | |
| Price / MAexp7: | +2.30% | |
| Price / MAexp20: | +4.40% | |
| Price / MAexp50: | +6.56% | |
| Price / MAexp100: | +9.03% |
News
The latest news and videos published on QORVO INC. at the time of the analysis were as follows:
- Market Trends Toward New Normal in Qorvo, Stag Industrial, Antero Midstream Partners LP, Armstrong Flooring, II-VI, and Genesis Energy — Emerging Consolidated Expectations, Analyst Ratings
- Market Trends Toward New Normal in Summit Midstream Partners, LP, Consolidated Edison, Genesis Energy, Qorvo, Stag Industrial, and Pilgrim's Pride — Emerging Consolidated Expectations, Analyst Ratings
- Report: Developing Opportunities within Clean Energy Fuels, Catalyst Pharmaceuticals, Qorvo, Brunswick, DCT Industrial Trust, and Radius Health — Future Expectations, Projections Moving into 2018
-
 Qorvo
Qorvo
- Qorvo® Reports Fiscal 2017 Third Quarter Results
About author

Online


Add a comment
Comments
0 comments on the analysis QORVO INC. - Daily