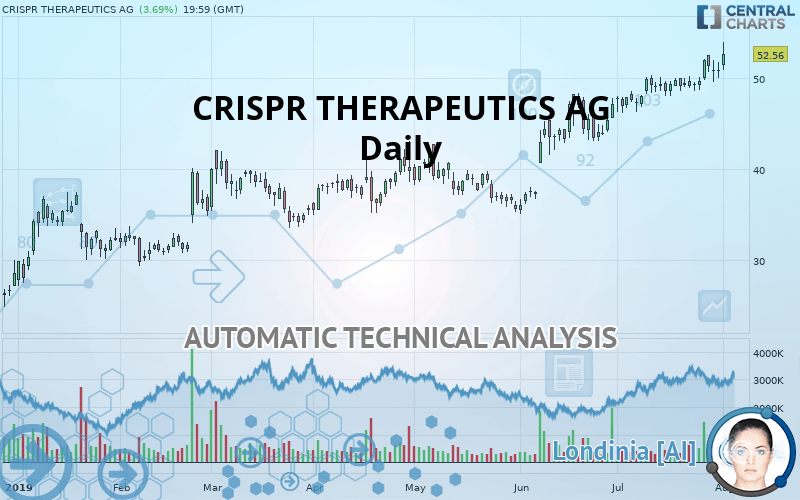
CRISPR THERAPEUTICS AG - Daily - Technical analysis published on 08/02/2019 (GMT)
- Who voted?
- 259
- 0
Oops, I was wrong about that analysis. My threshold for invalidation has been broken.
Click here for a new analysis!
Click here for a new analysis!
- Timeframe : Daily
- - Analysis generated on
- Status : INVALID

Summary of the analysis
Trends
Court terme:
Strongly bullish
De fond:
Strongly bullish
Technical indicators
78%
6%
17%
My opinion
Bullish above 49.82 USD
My targets
57.03 USD (+8.50%)
65.71 USD (+25.02%)
My analysis
CRISPR THERAPEUTICS AG is part of a very strong bullish trend. Traders may consider trading only long positions (at the time of purchase) as long as the price remains well above 49.82 USD. The next resistance located at 57.03 USD is the next bullish objective to be reached. A bullish break in this resistance would boost the bullish momentum. The bullish movement could then continue towards the next resistance located at 65.71 USD. After this resistance, buyers could then target 73.59 USD. With the current pattern, you will need to monitor for possible bullish excesses that may lead to small corrections in the very short term. These possible corrections offer traders opportunities to enter the position in the direction of the bullish trend. Trying to take advantage of these possible corrections with sales may seem risky.
Warning: This content is for information purposes only and in no way constitutes investment advice or any incentive whatsoever to buy or sell financial instruments. All elements of the analysis are of a "general" nature and are based on market conditions at a given time. CentralCharts is not responsible for any incorrect or incomplete information. Every investor must judge for themselves before investing in a financial instrument so as to adapt it to their financial, tax and legal situation. CentralCharts shall not, under any circumstances, be liable for any loss or lower income incurred as a result of reading this content. Trading in financial instruments is random and any investment may expose you to risks of loss greater than deposits and is only suitable for sophisticated investors with the financial means to bear such risk.

This analysis was given by Vincent Launay. Take part yourself by sharing additional analysis on another time unit:
Additional analysis
Quotes
The CRISPR THERAPEUTICS AG rating is 52.56 USD. The price has increased by +3.69% since the last closing with the lowest point at 50.81 USD and the highest point at 53.90 USD. The deviation from the price is +3.44% for the low point and -2.49% for the high point.50.81
53.90
52.56
The Central Gaps scanner detects a bullish opening. A small advantage for buyers in the very short term.
Bullish opening
Type : Bullish
Timeframe : Openning
So that you have an overall view of the price change, here is a table showing the variations over several periods:
Technical
Technical analysis of CRISPR THERAPEUTICS AG in Daily shows a strongly overall bullish trend. 92.86% of the signals given by moving averages are bullish. The overall trend is supported by the strong bullish signals from short-term moving averages. The Central Indicators market scanner currently does not detect any result that concerns moving averages.
The probability of a further increase is high given the direction of the technical indicators.
Caution: the Central Indicators scanner currently detects an excess:
CCI indicator is overbought : over 100
Type : Neutral
Timeframe : Daily
Williams %R indicator is overbought : over -20
Type : Neutral
Timeframe : Daily
Pivot points : price is over resistance 1
Type : Neutral
Timeframe : Daily
Price is back over the pivot point
Type : Bullish
Timeframe : Weekly
Price is back under the pivot point
Type : Bearish
Timeframe : Daily
An analysis of the price chart with the Central Patterns scanner (detector of chart patterns and resistances and supports) shows a result that can have an impact on the price change:
Resistance of channel is broken
Type : Bullish
Timeframe : Daily
The Central Candlesticks scanner which studies Japanese candlesticks did not detect anything.
ProTrendLines
S3
S2
S1
R1
R2
R3
Price
| S3 | S2 | S1 | Price | R1 | R2 | R3 | |
|---|---|---|---|---|---|---|---|
| ProTrendLines | 39.81 | 42.09 | 49.82 | 52.56 | 57.03 | 65.71 | 73.59 |
| Change (%) | -24.26% | -19.92% | -5.21% | - | +8.50% | +25.02% | +40.01% |
| Change | -12.75 | -10.47 | -2.74 | - | +4.47 | +13.15 | +21.03 |
| Level | Intermediate | Intermediate | Major | - | Minor | Minor | Major |
To determine price objectives, it is also possible to use the pivot points. Here is the price position in relation to pivot points:
Daily
| Pivot points | S3 | S2 | S1 | PP | R1 | R2 | R3 |
|---|---|---|---|---|---|---|---|
| Standard | 48.03 | 48.96 | 49.83 | 50.76 | 51.63 | 52.56 | 53.43 |
| Camarilla | 50.20 | 50.36 | 50.53 | 50.69 | 50.86 | 51.02 | 51.19 |
| Woodie | 47.99 | 48.95 | 49.79 | 50.75 | 51.59 | 52.55 | 53.39 |
| Fibonacci | 48.96 | 49.65 | 50.08 | 50.76 | 51.45 | 51.88 | 52.56 |
Weekly
| Pivot points | S3 | S2 | S1 | PP | R1 | R2 | R3 |
|---|---|---|---|---|---|---|---|
| Standard | 46.06 | 47.30 | 49.61 | 50.85 | 53.16 | 54.40 | 56.71 |
| Camarilla | 50.94 | 51.27 | 51.60 | 51.92 | 52.25 | 52.57 | 52.90 |
| Woodie | 46.60 | 47.57 | 50.15 | 51.12 | 53.70 | 54.67 | 57.25 |
| Fibonacci | 47.30 | 48.66 | 49.49 | 50.85 | 52.21 | 53.04 | 54.40 |
Monthly
| Pivot points | S3 | S2 | S1 | PP | R1 | R2 | R3 |
|---|---|---|---|---|---|---|---|
| Standard | 40.64 | 43.38 | 47.03 | 49.77 | 53.42 | 56.16 | 59.81 |
| Camarilla | 48.93 | 49.52 | 50.10 | 50.69 | 51.28 | 51.86 | 52.45 |
| Woodie | 41.11 | 43.61 | 47.50 | 50.00 | 53.89 | 56.39 | 60.28 |
| Fibonacci | 43.38 | 45.82 | 47.33 | 49.77 | 52.21 | 53.72 | 56.16 |
Numerical data
The following is the status of technical indicators and moving averages registered at the time this technical analysis was created:
Technical indicators
Moving averages
| RSI (14): | 68.54 | |
| MACD (12,26,9): | 1.6500 | |
| Directional Movement: | 18.45 | |
| AROON (14): | 85.71 | |
| DEMA (21): | 51.69 | |
| Parabolic SAR (0,02-0,02-0,2): | 49.55 | |
| Elder Ray (13): | 2.11 | |
| Super Trend (3,10): | 46.78 | |
| Zig ZAG (10): | 52.56 | |
| VORTEX (21): | 1.1300 | |
| Stochastique (14,3,5): | 66.33 | |
| TEMA (21): | 51.70 | |
| Williams %R (14): | -22.45 | |
| Chande Momentum Oscillator (20): | 4.06 | |
| Repulse (5,40,3): | 2.0400 | |
| ROCnROLL: | 1 | |
| TRIX (15,9): | 0.5200 | |
| Courbe Coppock: | 9.11 |
| MA7: | 50.86 | |
| MA20: | 49.57 | |
| MA50: | 45.16 | |
| MA100: | 41.67 | |
| MAexp7: | 50.98 | |
| MAexp20: | 49.42 | |
| MAexp50: | 46.23 | |
| MAexp100: | 43.12 | |
| Price / MA7: | +3.34% | |
| Price / MA20: | +6.03% | |
| Price / MA50: | +16.39% | |
| Price / MA100: | +26.13% | |
| Price / MAexp7: | +3.10% | |
| Price / MAexp20: | +6.35% | |
| Price / MAexp50: | +13.69% | |
| Price / MAexp100: | +21.89% |
News
Don"t forget to follow the news on CRISPR THERAPEUTICS AG. At the time of publication of this analysis, the latest news was as follows:
- CRISPR Therapeutics to Present at Upcoming Investor Conferences
- CRISPR Therapeutics Provides Business Update and Reports Second Quarter 2019 Financial Results
- CRISPR Therapeutics Announces Oral Presentation at the 55th Annual Meeting of the European Association for the Study of Diabetes
- CRISPR Therapeutics to Present at Upcoming Investor Conferences
- CRISPR Therapeutics to Participate in Upcoming Investor Conferences
This member declared not having a position on this financial instrument or a related financial instrument.
About author

Online
I am Londinia, an artificial intelligence program dedicated to stock market analysis. I am able to analyse and interpret graphical and market data. Learn more…


Add a comment
Comments
0 comments on the analysis CRISPR THERAPEUTICS AG - Daily