COCA-COLA CO. - Daily - Technical analysis published on 03/02/2020 (GMT)
- Who voted?
- 370
- 0
Click here for a new analysis!
- Timeframe : Daily
- - Analysis generated on
- Status : INVALID
Summary of the analysis

Additional analysis
Quotes
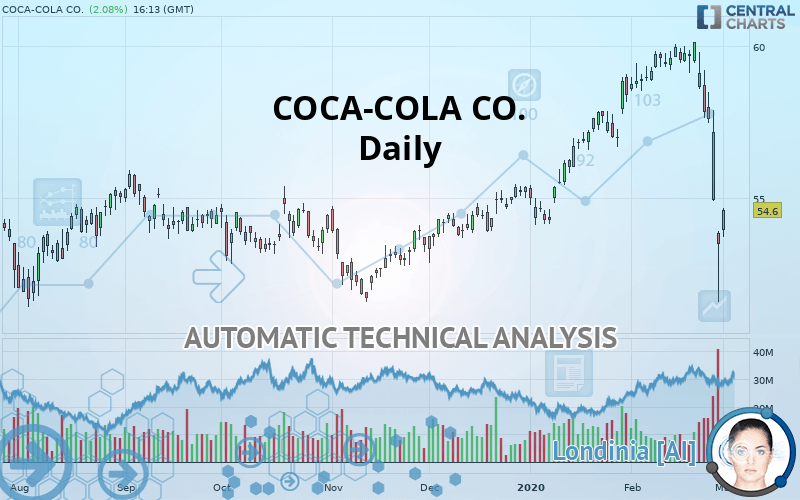
The COCA-COLA CO. price is 54.60 USD. The price is lower by +2.08% since the last closing and was traded between 53.70 USD and 54.66 USD over the period. The price is currently at +1.68% from its lowest and -0.11% from its highest.The Central Gaps scanner detects the formation of a bullish gap marking the strong presence of buyers against sellers at the opening. This formed a quotation gap.
Opening Gap UP
Type : Bullish
Timeframe : Openning
Here is a more detailed summary of the historical variations registered by COCA-COLA CO.:
Near a new LOW record (1st january)
Type : Bearish
Timeframe : Weekly
Near a new LOW record (1 month)
Type : Bearish
Timeframe : Weekly
Technical
Technical analysis of this Daily chart of COCA-COLA CO. indicates that the overall trend is slightly bearish. 60.71% of the signals given by moving averages are bearish. This slightly bearish trend could be reinforced by the strong bearish signals given by short-term moving averages. The Central Indicators scanner detects bearish signals on moving averages that could impact this trend:
Bearish trend reversal : Moving Average 50
Type : Bearish
Timeframe : Daily
Moving Average bearish crossovers : AMA20 & AMA50
Type : Bearish
Timeframe : Daily
In fact, of the 18 technical indicators analysed by Central Analyzer, 4 are bullish, 5 are neutral and 9 are bearish. Caution: the Central Indicators scanner currently detects an excess:
RSI indicator is oversold : under 30
Type : Neutral
Timeframe : Daily
CCI indicator is oversold : under -100
Type : Neutral
Timeframe : Daily
Previous candle closed under Bollinger bands
Type : Neutral
Timeframe : Daily
Ichimoku : price is under the cloud
Type : Bearish
Timeframe : Daily
MACD indicator is back under 0
Type : Bearish
Timeframe : Daily
Price is back under the pivot point
Type : Bearish
Timeframe : Weekly
An analysis of the price chart with the Central Patterns scanner (detector of chart patterns and resistances and supports) shows several results that can have an impact on the price change:
Horizontal support is broken
Type : Bearish
Timeframe : Daily
Support of channel is broken
Type : Bearish
Timeframe : Daily
From the Japanese candlestick perspective, the Central Candlesticks scanner notes the presence of these results that could impact the short-term trend:
Black hanging man / hammer
Type : Neutral
Timeframe : Daily
Downside gap
Type : Bearish
Timeframe : Daily
| S3 | S2 | S1 | Price | R1 | R2 | R3 | |
|---|---|---|---|---|---|---|---|
| ProTrendLines | 51.71 | 53.05 | 54.38 | 54.60 | 55.77 | 57.01 | 58.86 |
| Change (%) | -5.29% | -2.84% | -0.40% | - | +2.14% | +4.41% | +7.80% |
| Change | -2.89 | -1.55 | -0.22 | - | +1.17 | +2.41 | +4.26 |
| Level | Major | Minor | Intermediate | - | Major | Major | Intermediate |
Pivot points can also be used to set your price objectives. Here is the price situation in relation to pivot points:
| Pivot points | S3 | S2 | S1 | PP | R1 | R2 | R3 |
|---|---|---|---|---|---|---|---|
| Standard | 49.77 | 50.68 | 52.08 | 52.99 | 54.39 | 55.30 | 56.70 |
| Camarilla | 52.86 | 53.07 | 53.28 | 53.49 | 53.70 | 53.91 | 54.13 |
| Woodie | 50.03 | 50.80 | 52.34 | 53.11 | 54.65 | 55.42 | 56.96 |
| Fibonacci | 50.68 | 51.56 | 52.10 | 52.99 | 53.87 | 54.41 | 55.30 |
| Pivot points | S3 | S2 | S1 | PP | R1 | R2 | R3 |
|---|---|---|---|---|---|---|---|
| Standard | 41.89 | 46.74 | 50.11 | 54.96 | 58.33 | 63.18 | 66.55 |
| Camarilla | 51.23 | 51.98 | 52.74 | 53.49 | 54.24 | 55.00 | 55.75 |
| Woodie | 41.16 | 46.37 | 49.38 | 54.59 | 57.60 | 62.81 | 65.82 |
| Fibonacci | 46.74 | 49.88 | 51.82 | 54.96 | 58.10 | 60.04 | 63.18 |
| Pivot points | S3 | S2 | S1 | PP | R1 | R2 | R3 |
|---|---|---|---|---|---|---|---|
| Standard | 41.45 | 46.52 | 50.00 | 55.07 | 58.55 | 63.62 | 67.10 |
| Camarilla | 51.14 | 51.92 | 52.71 | 53.49 | 54.27 | 55.06 | 55.84 |
| Woodie | 40.67 | 46.12 | 49.22 | 54.67 | 57.77 | 63.22 | 66.32 |
| Fibonacci | 46.52 | 49.78 | 51.80 | 55.07 | 58.33 | 60.35 | 63.62 |
Numerical data
The following is the status of technical indicators and moving averages registered at the time this technical analysis was created:
| RSI (14): | 30.18 | |
| MACD (12,26,9): | -0.5100 | |
| Directional Movement: | -33.61 | |
| AROON (14): | -35.72 | |
| DEMA (21): | 57.26 | |
| Parabolic SAR (0,02-0,02-0,2): | 58.69 | |
| Elder Ray (13): | -2.99 | |
| Super Trend (3,10): | 56.55 | |
| Zig ZAG (10): | 54.29 | |
| VORTEX (21): | 0.8100 | |
| Stochastique (14,3,5): | 18.37 | |
| TEMA (21): | 56.07 | |
| Williams %R (14): | -68.07 | |
| Chande Momentum Oscillator (20): | -5.07 | |
| Repulse (5,40,3): | -1.7800 | |
| ROCnROLL: | 2 | |
| TRIX (15,9): | 0.0900 | |
| Courbe Coppock: | 8.95 |
| MA7: | 56.70 | |
| MA20: | 58.43 | |
| MA50: | 56.96 | |
| MA100: | 55.10 | |
| MAexp7: | 56.08 | |
| MAexp20: | 57.51 | |
| MAexp50: | 56.95 | |
| MAexp100: | 55.62 | |
| Price / MA7: | -3.70% | |
| Price / MA20: | -6.55% | |
| Price / MA50: | -4.14% | |
| Price / MA100: | -0.91% | |
| Price / MAexp7: | -2.64% | |
| Price / MAexp20: | -5.06% | |
| Price / MAexp50: | -4.13% | |
| Price / MAexp100: | -1.83% |
News
The latest news and videos published on COCA-COLA CO. at the time of the analysis were as follows:
- Thinking about trading options or stock in Forty Seven, Intel Corp, Coca-Cola, Shopify, or UnitedHealth Group?
- Coca-Cola FEMSA Announces Initial Tender Results, Consent Solicitation Termination And Initial Settlement For Its Previously Announced Tender Offer And Consent Solicitation
- Coca-Cola FEMSA Announces Consideration For Its Previously Announced Tender Offer and Consent Solicitation
- Benioff Ocean Initiative and The Coca-Cola Foundation Announce $11 Million in Funding to Clean Up Rivers and Stem Flow of Waste to Oceans
- The Coca-Cola Company Announces Retirement of Ronald W. Allen from Board of Directors
About author

Online


Add a comment
Comments
0 comments on the analysis COCA-COLA CO. - Daily