COCA-COLA HBC AG ORD CHF6.70 (CDI) - Daily - Technical analysis published on 11/19/2019 (GMT)
- Who voted?
- 233
- 0
Click here for a new analysis!
- Timeframe : Daily
- - Analysis generated on
- Status : INVALID

Summary of the analysis

Additional analysis
Quotes
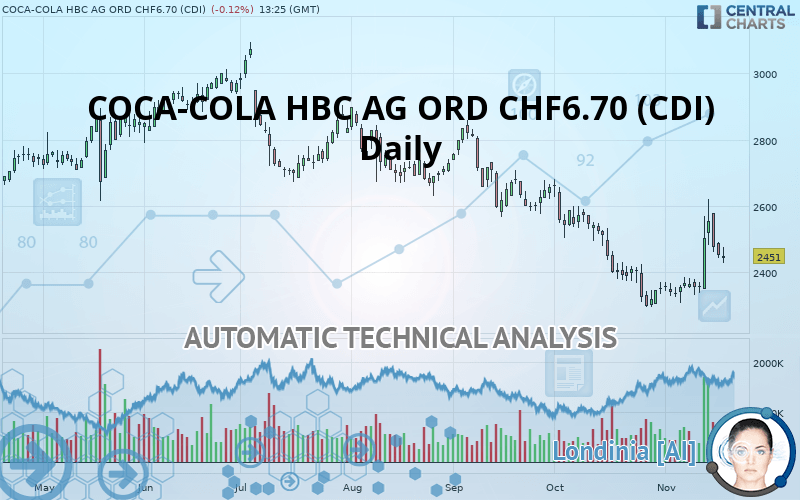
The COCA-COLA HBC AG ORD CHF6.70 (CDI) rating is 2,451 GBX. The price registered a decrease of -0.12% on the session and was traded between 2,428 GBX and 2,476 GBX over the period. The price is currently at +0.95% from its lowest and -1.01% from its highest.The Central Gaps scanner detects a bearish opening. A small advantage for sellers in the very short term.
Bearish opening
Type : Bearish
Timeframe : Openning
A study of price movements over other periods shows the following variations:
Near a new HIGH record (1st january)
Type : Bullish
Timeframe : Weekly
Technical
A technical analysis in Daily of this COCA-COLA HBC AG ORD CHF6.70 (CDI) chart shows a bearish trend. 71.43% of the signals given by moving averages are bearish. Caution: as the signals currently given by short-term moving averages are rather neutral, the bearish trend could slow down. The Central Indicators scanner detects bullish signals on moving averages that could impact this trend:
Bullish price crossover with Moving Average 20
Type : Bullish
Timeframe : Daily
Bullish price crossover with adaptative moving average 20
Type : Bullish
Timeframe : Daily
An assessment of technical indicators shows a slightly bullish signal.
Caution: the Central Indicators scanner currently detects an excess:
CCI indicator is overbought : over 100
Type : Neutral
Timeframe : Daily
Williams %R indicator is overbought : over -20
Type : Neutral
Timeframe : Daily
Pivot points : price is over resistance 3
Type : Neutral
Timeframe : Weekly
RSI indicator is back over 50
Type : Bullish
Timeframe : Daily
Price is back under the pivot point
Type : Bearish
Timeframe : Daily
Momentum indicator is back over 0
Type : Bullish
Timeframe : Daily
The Central Patterns scanner, which studies chart patterns, resistances and supports, has identified these signals:
Near horizontal resistance
Type : Bearish
Timeframe : Daily
Near resistance of triangle
Type : Bearish
Timeframe : Daily
No result was found by the Central Candlesticks scanner on Japanese candlesticks.
| S3 | S2 | S1 | Price | R1 | R2 | R3 | |
|---|---|---|---|---|---|---|---|
| ProTrendLines | 2,230 | 2,299 | 2,367 | 2,451 | 2,483 | 2,555 | 2,675 |
| Change (%) | -9.02% | -6.20% | -3.43% | - | +1.31% | +4.24% | +9.14% |
| Change | -221 | -152 | -84 | - | +32 | +104 | +224 |
| Level | Major | Minor | Major | - | Intermediate | Intermediate | Major |
To determine price objectives, it is also possible to use the pivot points. Here is the price position in relation to pivot points:
| Pivot points | S3 | S2 | S1 | PP | R1 | R2 | R3 |
|---|---|---|---|---|---|---|---|
| Standard | 2,387 | 2,415 | 2,435 | 2,463 | 2,483 | 2,511 | 2,531 |
| Camarilla | 2,441 | 2,445 | 2,450 | 2,454 | 2,458 | 2,463 | 2,467 |
| Woodie | 2,382 | 2,413 | 2,430 | 2,461 | 2,478 | 2,509 | 2,526 |
| Fibonacci | 2,415 | 2,434 | 2,445 | 2,463 | 2,482 | 2,493 | 2,511 |
| Pivot points | S3 | S2 | S1 | PP | R1 | R2 | R3 |
|---|---|---|---|---|---|---|---|
| Standard | 1,201 | 1,221 | 1,233 | 1,252 | 1,265 | 1,284 | 1,297 |
| Camarilla | 1,237 | 1,240 | 1,243 | 1,246 | 1,249 | 1,252 | 1,255 |
| Woodie | 1,198 | 1,219 | 1,230 | 1,251 | 1,262 | 1,283 | 1,294 |
| Fibonacci | 1,221 | 1,233 | 1,240 | 1,252 | 1,265 | 1,272 | 1,284 |
| Pivot points | S3 | S2 | S1 | PP | R1 | R2 | R3 |
|---|---|---|---|---|---|---|---|
| Standard | 1,820 | 2,058 | 2,204 | 2,442 | 2,588 | 2,826 | 2,972 |
| Camarilla | 2,244 | 2,280 | 2,315 | 2,350 | 2,385 | 2,420 | 2,456 |
| Woodie | 1,774 | 2,035 | 2,158 | 2,419 | 2,542 | 2,803 | 2,926 |
| Fibonacci | 2,058 | 2,205 | 2,295 | 2,442 | 2,589 | 2,679 | 2,826 |
Numerical data
The following are the details of the technical indicators and moving averages that were collected to generate this technical analysis:
| RSI (14): | 51.00 | |
| MACD (12,26,9): | -10.0000 | |
| Directional Movement: | 4 | |
| AROON (14): | 42 | |
| DEMA (21): | 2,393 | |
| Parabolic SAR (0,02-0,02-0,2): | 2,608 | |
| Elder Ray (13): | 35 | |
| Super Trend (3,10): | 2,610 | |
| Zig ZAG (10): | 2,439 | |
| VORTEX (21): | 1.0000 | |
| Stochastique (14,3,5): | 32.00 | |
| TEMA (21): | 2,430 | |
| Williams %R (14): | -58.00 | |
| Chande Momentum Oscillator (20): | 99 | |
| Repulse (5,40,3): | -4.0000 | |
| ROCnROLL: | -1 | |
| TRIX (15,9): | 0.0000 | |
| Courbe Coppock: | 8.00 |
| MA7: | 2,445 | |
| MA20: | 2,382 | |
| MA50: | 2,491 | |
| MA100: | 2,628 | |
| MAexp7: | 2,429 | |
| MAexp20: | 2,419 | |
| MAexp50: | 2,487 | |
| MAexp100: | 2,571 | |
| Price / MA7: | +0.25% | |
| Price / MA20: | +2.90% | |
| Price / MA50: | -1.61% | |
| Price / MA100: | -6.74% | |
| Price / MAexp7: | +0.91% | |
| Price / MAexp20: | +1.32% | |
| Price / MAexp50: | -1.45% | |
| Price / MAexp100: | -4.67% |
About author

Online


Add a comment
Comments
0 comments on the analysis COCA-COLA HBC AG ORD CHF6.70 (CDI) - Daily