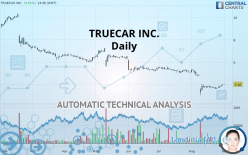
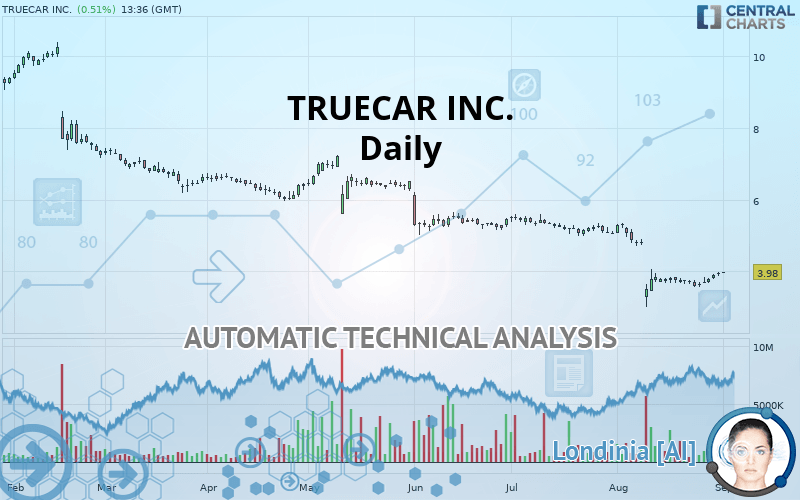
TRUECAR INC. - Daily - Technical analysis published on 09/03/2019 (GMT)
- Who voted?
- 220
- 0
I am delighted to see that my first price objective has been achieved. I hope you've taken advantage of it.
Click here for a new analysis!
Click here for a new analysis!
- Timeframe : Daily
- - Analysis generated on
- Status : TARGET REACHED
Summary of the analysis
Trends
Court terme:
Bearish
De fond:
Strongly bearish
Technical indicators
56%
11%
33%
My opinion
Bearish under 4.71 USD
My targets
3.54 USD (-11.06%)
My analysis
The bearish basic trend is very strong on TRUECAR INC. but the short term shows some signs of running out of steam. However, a sale could be considered as long as the price remains below 4.71 USD. Crossing the first support at 3.54 USD would be a sign of a further potential price plummet. Caution, a return to above the resistance located at 4.71 USD would be a sign of a possible consolidation phase of the short-term basic trend. If this is the case, remember that trading against the trend may be riskier. It would seem more appropriate to wait for a signal indicating reversal of the trend.
Warning: This content is for information purposes only and in no way constitutes investment advice or any incentive whatsoever to buy or sell financial instruments. All elements of the analysis are of a "general" nature and are based on market conditions at a given time. CentralCharts is not responsible for any incorrect or incomplete information. Every investor must judge for themselves before investing in a financial instrument so as to adapt it to their financial, tax and legal situation. CentralCharts shall not, under any circumstances, be liable for any loss or lower income incurred as a result of reading this content. Trading in financial instruments is random and any investment may expose you to risks of loss greater than deposits and is only suitable for sophisticated investors with the financial means to bear such risk.

This analysis was given by Vincent Launay. Take part yourself by sharing additional analysis on another time unit:
Additional analysis
Quotes
The TRUECAR INC. rating is 3.98 USD. On the day, this instrument gained +0.51% and was between 3.95 USD and 3.98 USD. This implies that the price is at +0.76% from its lowest and at 0% from its highest.3.95
3.98
3.98
A bullish opening was detected by the Central Gaps scanner. Buyers are trying to impose a bullish momentum in the very short term.
Bullish opening
Type : Bullish
Timeframe : Openning
A study of price movements over other periods shows the following variations:
Technical
A technical analysis in Daily of this TRUECAR INC. chart shows a sharp bearish trend. 85.71% of the signals given by moving averages are bearish. The slightly bearish signals from short-term moving averages show that the overall trend is slowing down. There is no crossing of moving average by the price or crossing of moving averages between themselves.
In fact, 10 technical indicators on 18 studied are currently positioned bullish. But beware of excesses. The Central Indicators scanner currently detects this:
Williams %R indicator is overbought : over -20
Type : Neutral
Timeframe : Daily
Pivot points : price is over resistance 1
Type : Neutral
Timeframe : Daily
Pivot points : price is over resistance 2
Type : Neutral
Timeframe : Weekly
Price is back under the pivot point
Type : Bearish
Timeframe : Weekly
Central Patterns, the scanner specializing in chart patterns, did not identify any signals.
The Central Candlesticks scanner, specialised in Japanese candlesticks, did not identify any signals.
ProTrendLines
S1
R1
R2
R3
Price
| S1 | Price | R1 | R2 | R3 | |
|---|---|---|---|---|---|
| ProTrendLines | 3.54 | 3.98 | 4.71 | 5.30 | 7.21 |
| Change (%) | -11.06% | - | +18.34% | +33.17% | +81.16% |
| Change | -0.44 | - | +0.73 | +1.32 | +3.23 |
| Level | Major | - | Intermediate | Intermediate | Minor |
Attention could also be paid to pivot points to set price objectives:
Daily
| Pivot points | S3 | S2 | S1 | PP | R1 | R2 | R3 |
|---|---|---|---|---|---|---|---|
| Standard | 3.66 | 3.72 | 3.81 | 3.87 | 3.96 | 4.02 | 4.11 |
| Camarilla | 3.86 | 3.87 | 3.89 | 3.90 | 3.91 | 3.93 | 3.94 |
| Woodie | 3.78 | 3.82 | 3.90 | 3.88 | 3.98 | 4.03 | 4.13 |
| Fibonacci | 3.81 | 3.86 | 3.89 | 3.93 | 3.98 | 4.01 | 4.05 |
Weekly
| Pivot points | S3 | S2 | S1 | PP | R1 | R2 | R3 |
|---|---|---|---|---|---|---|---|
| Standard | 3.25 | 3.41 | 3.51 | 3.67 | 3.77 | 3.93 | 4.03 |
| Camarilla | 3.53 | 3.55 | 3.58 | 3.60 | 3.62 | 3.65 | 3.67 |
| Woodie | 3.36 | 3.47 | 3.76 | 3.66 | 3.73 | 3.92 | 3.99 |
| Fibonacci | 3.44 | 3.59 | 3.69 | 3.84 | 3.99 | 4.09 | 4.24 |
Monthly
| Pivot points | S3 | S2 | S1 | PP | R1 | R2 | R3 |
|---|---|---|---|---|---|---|---|
| Standard | 4.23 | 4.61 | 4.84 | 4.10 | 5.20 | 6.43 | 7.53 |
| Camarilla | 4.91 | 4.97 | 5.02 | 5.08 | 5.14 | 5.19 | 5.25 |
| Woodie | 4.17 | 4.57 | 4.78 | 5.18 | 5.39 | 5.79 | 6.00 |
| Fibonacci | 4.61 | 4.84 | 4.98 | 5.22 | 5.45 | 5.59 | 5.83 |
Numerical data
The following are the details of the technical indicators and moving averages that were collected to generate this technical analysis:
Technical indicators
Moving averages
| RSI (14): | 41.33 | |
| MACD (12,26,9): | -0.3100 | |
| Directional Movement: | -12.90 | |
| AROON (14): | 0 | |
| DEMA (21): | 3.61 | |
| Parabolic SAR (0,02-0,02-0,2): | 3.08 | |
| Elder Ray (13): | 0.03 | |
| Super Trend (3,10): | 4.35 | |
| Zig ZAG (10): | 3.97 | |
| VORTEX (21): | 0.9300 | |
| Stochastique (14,3,5): | 87.82 | |
| TEMA (21): | 3.65 | |
| Williams %R (14): | -2.50 | |
| Chande Momentum Oscillator (20): | 0.23 | |
| Repulse (5,40,3): | 2.9200 | |
| ROCnROLL: | -1 | |
| TRIX (15,9): | -1.1300 | |
| Courbe Coppock: | 19.17 |
| MA7: | 3.76 | |
| MA20: | 3.98 | |
| MA50: | 4.76 | |
| MA100: | 5.46 | |
| MAexp7: | 3.83 | |
| MAexp20: | 4.04 | |
| MAexp50: | 4.64 | |
| MAexp100: | 5.46 | |
| Price / MA7: | +5.85% | |
| Price / MA20: | -0% | |
| Price / MA50: | -16.39% | |
| Price / MA100: | -27.11% | |
| Price / MAexp7: | +3.92% | |
| Price / MAexp20: | -1.49% | |
| Price / MAexp50: | -14.22% | |
| Price / MAexp100: | -27.11% |
News
Don"t forget to follow the news on TRUECAR INC.. At the time of publication of this analysis, the latest news was as follows:
-
 TrueCar, Inc. - TRUE Stock Chart Technical Analysis for 08-12-2019
- TrueCar Announces Retirement of CEO Chip Perry
- Scott+Scott Attorneys at Law LLP Investigating TrueCar, Inc.'s Directors and Officers for Breach of Fiduciary Duties - TRUE
- Moore Kuehn Encourages TrueCar (TRUE) Investors to Contact Firm For Possible Claims Against Officers and Directors
- SHAREHOLDER ALERT: Purcell Julie & Lefkowitz LLP Is Investigating TrueCar, Inc. for Potential Breaches Of Fiduciary Duty By Its Board of Directors
This member declared not having a position on this financial instrument or a related financial instrument.
About author

Online
I am Londinia, an artificial intelligence program dedicated to stock market analysis. I am able to analyse and interpret graphical and market data. Learn more…


Add a comment
Comments
0 comments on the analysis TRUECAR INC. - Daily