AIMMUNE THERAPEUTICS INC. - Daily - Technical analysis published on 08/14/2019 (GMT)
- Who voted?
- 202
- 0
Click here for a new analysis!
- Timeframe : Daily
- - Analysis generated on
- Status : INVALID

Summary of the analysis
Additional analysis
Quotes
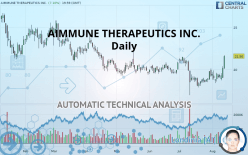
The AIMMUNE THERAPEUTICS INC. price is 21.56 USD. The price registered an increase of +7.10% on the session with the lowest point at 20.12 USD and the highest point at 21.67 USD. The deviation from the price is +7.16% for the low point and -0.51% for the high point.The Central Gaps scanner detects a bullish opening marking the presence of sellers ahead of buyers at the opening but not sufficiently marked to allow the price to register a quotation gap.
Bearish opening
Type : Bearish
Timeframe : Openning
Here is a more detailed summary of the historical variations registered by AIMMUNE THERAPEUTICS INC.:
Technical
Technical analysis of AIMMUNE THERAPEUTICS INC. in Daily shows an overall slightly bullish trend. 60.71% of the signals given by moving averages are bullish. This slightly bullish trend could be reinforced by the strong bullish signals given by short-term moving averages. The Central Indicators market scanner is currently detecting several bullish signals that could impact this trend:
Bullish trend reversal : Moving Average 50
Type : Bullish
Timeframe : Daily
Bullish trend reversal : adaptative moving average 50
Type : Bullish
Timeframe : Daily
Bullish price crossover with Moving Average 50
Type : Bullish
Timeframe : Daily
Bullish price crossover with adaptative moving average 20
Type : Bullish
Timeframe : Daily
In fact, 15 technical indicators on 18 studied are currently positioned bullish. Caution: the Central Indicators scanner currently detects an excess:
CCI indicator is overbought : over 100
Type : Neutral
Timeframe : Daily
Williams %R indicator is overbought : over -20
Type : Neutral
Timeframe : Daily
Pivot points : price is over resistance 2
Type : Neutral
Timeframe : Daily
Pivot points : price is over resistance 3
Type : Neutral
Timeframe : Weekly
RSI indicator is back over 50
Type : Bullish
Timeframe : Daily
Central Patterns, the market scanner focusing on chart patterns, resistances and supports found these results:
Horizontal resistance is broken
Type : Bullish
Timeframe : Daily
Resistance of channel is broken
Type : Bullish
Timeframe : Daily
Resistance of triangle is broken
Type : Bullish
Timeframe : Daily
The Central Candlesticks scanner which studies Japanese candlesticks did not detect anything.
| S3 | S2 | S1 | Price | R1 | R2 | R3 | |
|---|---|---|---|---|---|---|---|
| ProTrendLines | 16.43 | 19.01 | 21.52 | 21.56 | 26.61 | 29.62 | 32.18 |
| Change (%) | -23.79% | -11.83% | -0.19% | - | +23.42% | +37.38% | +49.26% |
| Change | -5.13 | -2.55 | -0.04 | - | +5.05 | +8.06 | +10.62 |
| Level | Major | Major | Intermediate | - | Major | Minor | Intermediate |
Pivot points can also be used to set your price objectives. Here is the price situation in relation to pivot points:
| Pivot points | S3 | S2 | S1 | PP | R1 | R2 | R3 |
|---|---|---|---|---|---|---|---|
| Standard | 17.95 | 18.48 | 19.30 | 19.83 | 20.65 | 21.18 | 22.00 |
| Camarilla | 19.76 | 19.88 | 20.01 | 20.13 | 20.25 | 20.38 | 20.50 |
| Woodie | 18.11 | 18.55 | 19.46 | 19.90 | 20.81 | 21.25 | 22.16 |
| Fibonacci | 18.48 | 18.99 | 19.31 | 19.83 | 20.34 | 20.66 | 21.18 |
| Pivot points | S3 | S2 | S1 | PP | R1 | R2 | R3 |
|---|---|---|---|---|---|---|---|
| Standard | 17.36 | 17.87 | 18.57 | 19.08 | 19.78 | 20.29 | 20.99 |
| Camarilla | 18.93 | 19.04 | 19.15 | 19.26 | 19.37 | 19.48 | 19.59 |
| Woodie | 17.45 | 17.92 | 18.66 | 19.13 | 19.87 | 20.34 | 21.08 |
| Fibonacci | 17.87 | 18.34 | 18.62 | 19.08 | 19.55 | 19.83 | 20.29 |
| Pivot points | S3 | S2 | S1 | PP | R1 | R2 | R3 |
|---|---|---|---|---|---|---|---|
| Standard | 12.40 | 14.68 | 16.96 | 19.24 | 21.52 | 23.80 | 26.08 |
| Camarilla | 18.00 | 18.41 | 18.83 | 19.25 | 19.67 | 20.09 | 20.50 |
| Woodie | 12.41 | 14.68 | 16.97 | 19.24 | 21.53 | 23.80 | 26.09 |
| Fibonacci | 14.68 | 16.42 | 17.50 | 19.24 | 20.98 | 22.06 | 23.80 |
Numerical data
The following is the status of the technical indicators and moving averages at the time of publication of this technical analysis:
| RSI (14): | 66.47 | |
| MACD (12,26,9): | 0.1500 | |
| Directional Movement: | 17.92 | |
| AROON (14): | 42.86 | |
| DEMA (21): | 19.59 | |
| Parabolic SAR (0,02-0,02-0,2): | 18.02 | |
| Elder Ray (13): | 1.27 | |
| Super Trend (3,10): | 18.29 | |
| Zig ZAG (10): | 21.56 | |
| VORTEX (21): | 1.0600 | |
| Stochastique (14,3,5): | 78.76 | |
| TEMA (21): | 19.93 | |
| Williams %R (14): | -3.35 | |
| Chande Momentum Oscillator (20): | 2.77 | |
| Repulse (5,40,3): | 14.8100 | |
| ROCnROLL: | 1 | |
| TRIX (15,9): | -0.1000 | |
| Courbe Coppock: | 11.81 |
| MA7: | 19.66 | |
| MA20: | 19.15 | |
| MA50: | 19.70 | |
| MA100: | 20.34 | |
| MAexp7: | 19.97 | |
| MAexp20: | 19.52 | |
| MAexp50: | 19.73 | |
| MAexp100: | 20.53 | |
| Price / MA7: | +9.66% | |
| Price / MA20: | +12.58% | |
| Price / MA50: | +9.44% | |
| Price / MA100: | +6.00% | |
| Price / MAexp7: | +7.96% | |
| Price / MAexp20: | +10.45% | |
| Price / MAexp50: | +9.28% | |
| Price / MAexp100: | +5.02% |
News
The latest news and videos published on AIMMUNE THERAPEUTICS INC. at the time of the analysis were as follows:
- Aimmune Therapeutics to Host Conference Call and Webcast to Discuss Second Quarter 2019 Financial Results and Recent Operational Highlights
- Aimmune to Present at the JMP Securities Life Sciences Conference
- U.S. FDA Accepts BLA Filing of Aimmune Therapeutics’ AR101 for Peanut Allergy
- Aimmune Therapeutics to Host Conference Call and Webcast to Discuss Fourth Quarter and Full-Year 2018 Financial Results and Recent Operational Highlights
- Investor Expectations to Drive Momentum within L3 Technologies, The Goldman Sachs Group, Genuine Parts, Bruker, Omeros, and Aimmune Therapeutics — Discovering Underlying Factors of Influence
About author

Online


Add a comment
Comments
0 comments on the analysis AIMMUNE THERAPEUTICS INC. - Daily