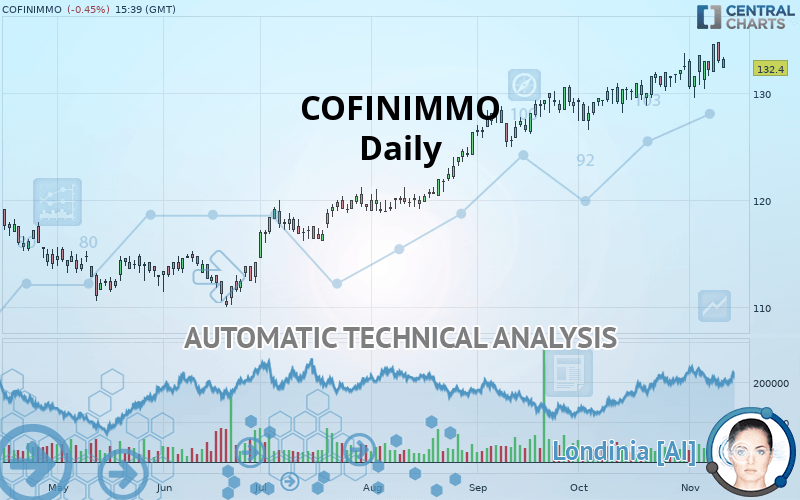
COFINIMMO - Daily - Technical analysis published on 11/12/2019 (GMT)
- Who voted?
- 162
- 0
Click here for a new analysis!
- Timeframe : Daily
- - Analysis generated on
- Status : TARGET REACHED

Summary of the analysis

Additional analysis
Quotes
COFINIMMO rating 132.4 EUR. The price registered a decrease of -0.45% on the session and was between 132.4 EUR and 133.4 EUR. This implies that the price is at 0% from its lowest and at -0.75% from its highest.Here is a more detailed summary of the historical variations registered by COFINIMMO:
New HIGH record (5 years)
Type : Bullish
Timeframe : Weekly
Near a new HIGH record (1st january)
Type : Bullish
Timeframe : Weekly
Technical
Technical analysis of this Daily chart of COFINIMMO indicates that the overall trend is strongly bullish. The signals given by the moving averages are 92.86% bullish. This strong bullish trend is confirmed by the strong signals currently being given by short-term moving averages. The Central Indicators market scanner currently does not detect any result that concerns moving averages.
An assessment of technical indicators shows a moderate bullish signal.
But beware of excesses. The Central Indicators scanner currently detects this:
CCI indicator is overbought : over 100
Type : Neutral
Timeframe : Daily
Previous candle closed over Bollinger bands
Type : Neutral
Timeframe : Daily
CCI indicator: bearish divergence
Type : Bearish
Timeframe : Daily
Williams %R indicator is overbought : over -20
Type : Neutral
Timeframe : Daily
Price is back over the pivot point
Type : Bullish
Timeframe : Weekly
Price is back under the pivot point
Type : Bearish
Timeframe : Daily
An analysis of the price chart with the Central Patterns scanner (detector of chart patterns and resistances and supports) shows several results that can have an impact on the price change:
Near horizontal resistance
Type : Bearish
Timeframe : Daily
Resistance of channel is broken
Type : Bullish
Timeframe : Daily
For a small setback in the very short term, the Central Candlesticks scanner currently notes the presence of this bearish pattern in Japanese candlesticks:
Dark cloud cover
Type : Bearish
Timeframe : Daily
| S3 | S2 | S1 | Price | R1 | R2 | R3 | |
|---|---|---|---|---|---|---|---|
| ProTrendLines | 121.6 | 125.1 | 130.6 | 132.4 | 133.9 | 141.4 | 158.4 |
| Change (%) | -8.16% | -5.51% | -1.36% | - | +1.13% | +6.80% | +19.64% |
| Change | -10.8 | -7.3 | -1.8 | - | +1.5 | +9.0 | +26.0 |
| Level | Minor | Minor | Major | - | Intermediate | Minor | Major |
Attention could also be paid to pivot points to set price objectives:
| Pivot points | S3 | S2 | S1 | PP | R1 | R2 | R3 |
|---|---|---|---|---|---|---|---|
| Standard | 130.3 | 131.5 | 132.3 | 133.5 | 134.3 | 135.5 | 136.3 |
| Camarilla | 132.5 | 132.6 | 132.8 | 133.0 | 133.2 | 133.4 | 133.6 |
| Woodie | 130.0 | 131.4 | 132.0 | 133.4 | 134.0 | 135.4 | 136.0 |
| Fibonacci | 131.5 | 132.3 | 132.8 | 133.5 | 134.3 | 134.8 | 135.5 |
| Pivot points | S3 | S2 | S1 | PP | R1 | R2 | R3 |
|---|---|---|---|---|---|---|---|
| Standard | 126.3 | 127.9 | 131.3 | 132.9 | 136.3 | 137.9 | 141.3 |
| Camarilla | 133.2 | 133.7 | 134.1 | 134.6 | 135.1 | 135.5 | 136.0 |
| Woodie | 127.1 | 128.4 | 132.1 | 133.4 | 137.1 | 138.4 | 142.1 |
| Fibonacci | 127.9 | 129.8 | 131.0 | 132.9 | 134.8 | 136.0 | 137.9 |
| Pivot points | S3 | S2 | S1 | PP | R1 | R2 | R3 |
|---|---|---|---|---|---|---|---|
| Standard | 121.0 | 123.8 | 128.2 | 131.0 | 135.4 | 138.2 | 142.6 |
| Camarilla | 130.6 | 131.3 | 131.9 | 132.6 | 133.3 | 133.9 | 134.6 |
| Woodie | 121.8 | 124.2 | 129.0 | 131.4 | 136.2 | 138.6 | 143.4 |
| Fibonacci | 123.8 | 126.6 | 128.3 | 131.0 | 133.8 | 135.5 | 138.2 |
Numerical data
The following is the status of the technical indicators and moving averages at the time of publication of this technical analysis:
| RSI (14): | 55.70 | |
| MACD (12,26,9): | 1.0000 | |
| Directional Movement: | 12.5 | |
| AROON (14): | 35.8 | |
| DEMA (21): | 133.1 | |
| Parabolic SAR (0,02-0,02-0,2): | 129.9 | |
| Elder Ray (13): | 0.6 | |
| Super Trend (3,10): | 128.8 | |
| Zig ZAG (10): | 132.4 | |
| VORTEX (21): | 1.1000 | |
| Stochastique (14,3,5): | 73.10 | |
| TEMA (21): | 133.0 | |
| Williams %R (14): | -46.20 | |
| Chande Momentum Oscillator (20): | 0.4 | |
| Repulse (5,40,3): | -0.7000 | |
| ROCnROLL: | 1 | |
| TRIX (15,9): | 0.1000 | |
| Courbe Coppock: | 2.60 |
| MA7: | 132.7 | |
| MA20: | 131.8 | |
| MA50: | 129.9 | |
| MA100: | 124.7 | |
| MAexp7: | 132.7 | |
| MAexp20: | 131.8 | |
| MAexp50: | 129.4 | |
| MAexp100: | 125.6 | |
| Price / MA7: | -0.23% | |
| Price / MA20: | +0.46% | |
| Price / MA50: | +1.92% | |
| Price / MA100: | +6.17% | |
| Price / MAexp7: | -0.23% | |
| Price / MAexp20: | +0.46% | |
| Price / MAexp50: | +2.32% | |
| Price / MAexp100: | +5.41% |
News
The last news published on COFINIMMO at the time of the generation of this analysis was as follows:
 Cofinimmo
About author

Online


Add a comment
Comments
0 comments on the analysis COFINIMMO - Daily