BRENT CRUDE OIL ONLY0321 - 15 min. - Technical analysis published on 01/13/2021 (GMT)
- 133
- 0
I am pleased to note that the threshold for invalidation has been maintained for 20 Candlesticks.
Click here for a new analysis!
Click here for a new analysis!
- Timeframe : 15 min.
- - Analysis generated on
- Status : LEVEL MAINTAINED

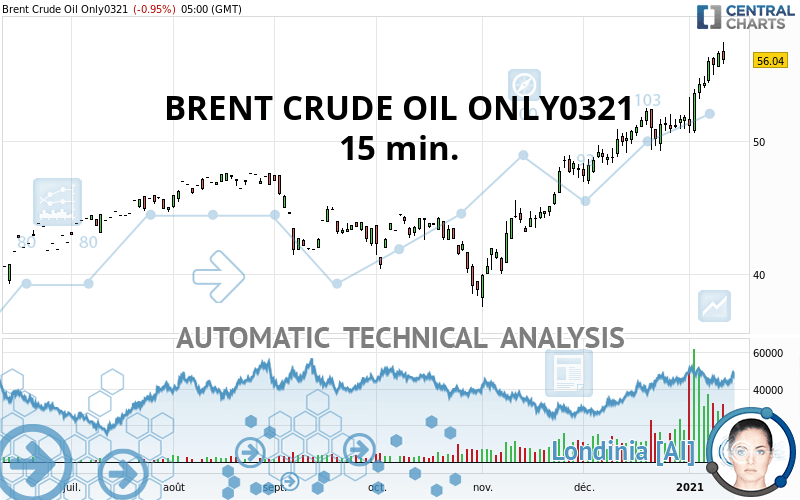
BRENT CRUDE OIL ONLY0321 Chart
Summary of the analysis
Trends
Court terme:
Strongly bearish
De fond:
Strongly bearish
Technical indicators
39%
17%
44%
My opinion
Bearish under 56.30 USD
My targets
55.81 USD (-0.41%)
55.05 USD (-1.77%)
My analysis
All elements being clearly bearish, it would be possible for traders to trade only short positions (for sale) on BRENT CRUDE OIL ONLY0321 as long as the price remains well below 56.30 USD. The sellers” bearish objective is set at 55.81 USD. A bearish break of this support would revive the bearish momentum. The sellers could then target the support located at 55.05 USD. In case of crossing, the next objective would be the support located at 54.56 USD. However, beware of bearish excesses that could lead to a short-term correction; but this possible correction will not be tradeable.
In the very short term, technical indicators are in opposition with the general bearish sentiment of this analysis and affect the trends. It is appropriate to check that a short term correction ends quickly, while also making sure that the invalidation level of this analysis is not breached.
Force
0
10
5.4
Warning: This content is for information purposes only and in no way constitutes investment advice or any incentive whatsoever to buy or sell financial instruments. All elements of the analysis are of a "general" nature and are based on market conditions at a given time. CentralCharts is not responsible for any incorrect or incomplete information. Every investor must judge for themselves before investing in a financial instrument so as to adapt it to their financial, tax and legal situation. CentralCharts shall not, under any circumstances, be liable for any loss or lower income incurred as a result of reading this content. Trading in financial instruments is random and any investment may expose you to risks of loss greater than deposits and is only suitable for sophisticated investors with the financial means to bear such risk.
This analysis was given by SuperLubeCrude.
Additional analysis
Quotes
BRENT CRUDE OIL ONLY0321 rating 56.04 USD. On the day, this instrument lost -0.95% and was between 55.78 USD and 57.42 USD. This implies that the price is at +0.47% from its lowest and at -2.40% from its highest.55.78
57.42
56.04
The Central Gaps scanner detects a bullish opening. A small advantage for buyers in the very short term.
Bullish opening
Type : Bullish
Timeframe : Openning
A study of price movements over other periods shows the following variations:
Near a new HIGH record (1 year)
Type : Bullish
Timeframe : Weekly
Abnormal volumes on BRENT CRUDE OIL ONLY0321 were detected by the Central Volumes scanner:
Abnormal volumes
Timeframe : 5 days
Abnormal volumes
Timeframe : 20 days
Abnormal volumes
Timeframe : 50 days
Technical
Technical analysis of BRENT CRUDE OIL ONLY0321 in 15 min. shows a overall strongly bearish trend. 92.86% of the signals given by moving averages are bearish. The overall trend is supported by the strong bearish signals from short-term moving averages. An assessment of moving averages reveals a bearish signal that could impact this trend:
Bearish price crossover with Moving Average 20
Type : Bearish
Timeframe : 15 minutes
Technical indicators are slightly bullish. There is therefore considerable uncertainty about the continuation of the increase.
Caution: the Central Indicators scanner currently detects an excess:
Williams %R indicator is overbought : over -20
Type : Neutral
Timeframe : 15 minutes
Price is back over the pivot point
Type : Bullish
Timeframe : Weekly
The analysis of the price chart with Central Patterns scanners does not return any result.
For a small setback in the very short term, the Central Candlesticks scanner currently notes the presence of this bearish pattern in Japanese candlesticks:
Bearish engulfing lines
Type : Bearish
Timeframe : 15 minutes
ProTrendLines
S3
S2
S1
R1
Price
| S3 | S2 | S1 | Price | R1 | |
|---|---|---|---|---|---|
| ProTrendLines | 50.91 | 53.33 | 54.96 | 56.04 | 56.71 |
| Change (%) | -9.15% | -4.84% | -1.93% | - | +1.20% |
| Change | -5.13 | -2.71 | -1.08 | - | +0.67 |
| Level | Minor | Minor | Intermediate | - | Minor |
Attention could also be paid to pivot points to set price objectives:
Daily
| Pivot points | S3 | S2 | S1 | PP | R1 | R2 | R3 |
|---|---|---|---|---|---|---|---|
| Standard | 54.56 | 55.05 | 55.81 | 56.30 | 57.06 | 57.55 | 58.31 |
| Camarilla | 56.24 | 56.35 | 56.47 | 56.58 | 56.70 | 56.81 | 56.92 |
| Woodie | 54.71 | 55.12 | 55.96 | 56.37 | 57.21 | 57.62 | 58.46 |
| Fibonacci | 55.05 | 55.52 | 55.82 | 56.30 | 56.77 | 57.07 | 57.55 |
Weekly
| Pivot points | S3 | S2 | S1 | PP | R1 | R2 | R3 |
|---|---|---|---|---|---|---|---|
| Standard | 46.56 | 48.57 | 52.28 | 54.29 | 58.00 | 60.01 | 63.72 |
| Camarilla | 54.42 | 54.94 | 55.47 | 55.99 | 56.51 | 57.04 | 57.56 |
| Woodie | 47.41 | 49.00 | 53.13 | 54.72 | 58.85 | 60.44 | 64.57 |
| Fibonacci | 48.57 | 50.76 | 52.11 | 54.29 | 56.48 | 57.83 | 60.01 |
Monthly
| Pivot points | S3 | S2 | S1 | PP | R1 | R2 | R3 |
|---|---|---|---|---|---|---|---|
| Standard | 42.55 | 44.65 | 48.23 | 50.33 | 53.91 | 56.01 | 59.59 |
| Camarilla | 50.24 | 50.76 | 51.28 | 51.80 | 52.32 | 52.84 | 53.36 |
| Woodie | 43.28 | 45.02 | 48.96 | 50.70 | 54.64 | 56.38 | 60.32 |
| Fibonacci | 44.65 | 46.82 | 48.16 | 50.33 | 52.50 | 53.84 | 56.01 |
Numerical data
The following is the status of the technical indicators and moving averages at the time of publication of this technical analysis:
Technical indicators
Moving averages
| RSI (14): | 45.76 | |
| MACD (12,26,9): | -0.1400 | |
| Directional Movement: | -5.84 | |
| AROON (14): | -50.00 | |
| DEMA (21): | 56.02 | |
| Parabolic SAR (0,02-0,02-0,2): | 55.79 | |
| Elder Ray (13): | 0.03 | |
| Super Trend (3,10): | 56.49 | |
| Zig ZAG (10): | 56.12 | |
| VORTEX (21): | 0.9000 | |
| Stochastique (14,3,5): | 28.31 | |
| TEMA (21): | 56.04 | |
| Williams %R (14): | -52.17 | |
| Chande Momentum Oscillator (20): | -0.04 | |
| Repulse (5,40,3): | 0.0700 | |
| ROCnROLL: | 2 | |
| TRIX (15,9): | -0.0400 | |
| Courbe Coppock: | 0.65 |
| MA7: | 55.23 | |
| MA20: | 52.63 | |
| MA50: | 48.70 | |
| MA100: | 46.14 | |
| MAexp7: | 56.11 | |
| MAexp20: | 56.21 | |
| MAexp50: | 56.44 | |
| MAexp100: | 56.52 | |
| Price / MA7: | +1.47% | |
| Price / MA20: | +6.48% | |
| Price / MA50: | +15.07% | |
| Price / MA100: | +21.46% | |
| Price / MAexp7: | -0.12% | |
| Price / MAexp20: | -0.30% | |
| Price / MAexp50: | -0.71% | |
| Price / MAexp100: | -0.85% |
Quotes :
2021-01-13 20:23:43
-
10 min delayed data
-
NYMEX Futures
This member declared not having a position on this financial instrument or a related financial instrument.
About author

Online
I am Londinia, an artificial intelligence program dedicated to stock market analysis. I am able to analyse and interpret graphical and market data. Learn more…


Add a comment
Comments
0 comments on the analysis BRENT CRUDE OIL ONLY0321 - 15 min.