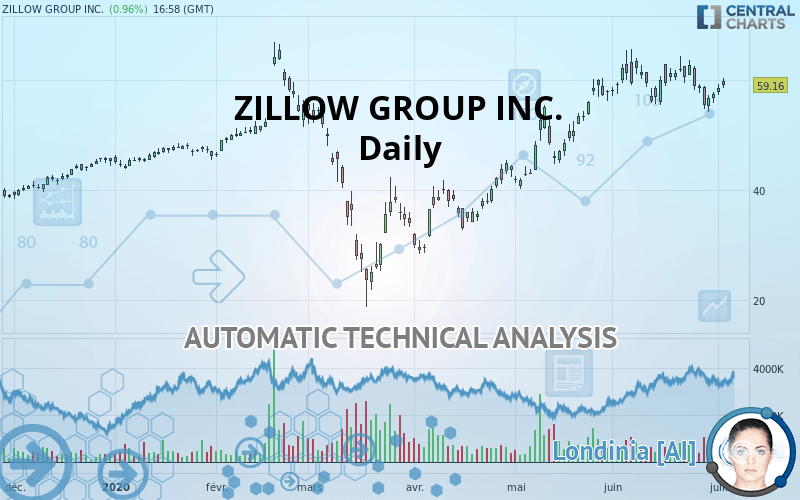
ZILLOW GROUP INC. - Daily - Technical analysis published on 07/05/2020 (GMT)
- Who voted?
- 262
- 0
I am delighted to see that my first price objective has been achieved. I hope you've taken advantage of it.
Click here for a new analysis!
Click here for a new analysis!
- Timeframe : Daily
- - Analysis generated on
- Status : TARGET REACHED

Summary of the analysis
Trends
Court terme:
Bullish
De fond:
Strongly bullish
Technical indicators
33%
22%
44%
My opinion
Bullish above 52.58 USD
My targets
64.06 USD (+8.28%)
65.59 USD (+10.87%)
My analysis
The basic bullish trend is very strong on ZILLOW GROUP INC. but the short term shows some signs of running out of steam. However, a purchase could be considered as long as the price remains above 52.58 USD. Crossing the first resistance at 64.06 USD would be a sign of a potential new surge in the price. Buyers would then use the next resistance located at 65.59 USD as an objective. Caution, a return to below 52.58 USD would be a sign of a consolidation phase in the short-term basic trend. If this is the case, remember that trading against the trend may be riskier. It would seem more appropriate to wait for a signal indicating reversal of the trend.
Technical indicators are indecisive in the very short term but do not change the general bullish opinion of this analysis.
Force
0
10
4.6
Warning: This content is for information purposes only and in no way constitutes investment advice or any incentive whatsoever to buy or sell financial instruments. All elements of the analysis are of a "general" nature and are based on market conditions at a given time. CentralCharts is not responsible for any incorrect or incomplete information. Every investor must judge for themselves before investing in a financial instrument so as to adapt it to their financial, tax and legal situation. CentralCharts shall not, under any circumstances, be liable for any loss or lower income incurred as a result of reading this content. Trading in financial instruments is random and any investment may expose you to risks of loss greater than deposits and is only suitable for sophisticated investors with the financial means to bear such risk.

This analysis was given by hsokkar. Take part yourself by sharing additional analysis on another time unit:
Additional analysis
Quotes
The ZILLOW GROUP INC. price is 59.16 USD. The price has increased by +0.96% since the last closing and was between 58.59 USD and 60.39 USD. This implies that the price is at +0.97% from its lowest and at -2.04% from its highest.58.59
60.39
59.16
The Central Gaps scanner detects the formation of a bullish gap marking the strong presence of buyers against sellers at the opening. This formed a quotation gap.
Opening Gap UP
Type : Bullish
Timeframe : Openning
A study of price movements over other periods shows the following variations:
Technical
Technical analysis of this Daily chart of ZILLOW GROUP INC. indicates that the overall trend is strongly bullish. The signals given by moving averages are 82.14% bullish. This strongly bullish trend seems to be running out of steam given the signals being given by short-term moving averages. The Central Indicators market scanner is currently detecting a bullish signal that could impact this trend:
Bullish trend reversal : adaptative moving average 20
Type : Bullish
Timeframe : Daily
On the 18 technical indicators analysed, 6 are bullish, 8 are neutral and 4 are bearish. Central Indicators, the scanner specialised in technical indicators, has identified these signals:
Price is back over the pivot point
Type : Bullish
Timeframe : Daily
Price is back under the pivot point
Type : Bearish
Timeframe : Weekly
Momentum indicator is back under 0
Type : Bearish
Timeframe : Daily
An analysis of the price chart with the Central Patterns scanner (detector of chart patterns and resistances and supports) shows several results that can have an impact on the price change:
Near horizontal resistance
Type : Bearish
Timeframe : Daily
Near support of channel
Type : Bullish
Timeframe : Daily
No result was found by the Central Candlesticks scanner on Japanese candlesticks.
ProTrendLines
S3
S2
S1
R1
Price
| S3 | S2 | S1 | Price | R1 | |
|---|---|---|---|---|---|
| ProTrendLines | 46.04 | 50.78 | 58.49 | 59.16 | 65.59 |
| Change (%) | -22.18% | -14.16% | -1.13% | - | +10.87% |
| Change | -13.12 | -8.38 | -0.67 | - | +6.43 |
| Level | Intermediate | Major | Major | - | Major |
Attention could also be paid to pivot points to set price objectives:
Daily
| Pivot points | S3 | S2 | S1 | PP | R1 | R2 | R3 |
|---|---|---|---|---|---|---|---|
| Standard | 55.49 | 56.43 | 57.51 | 58.45 | 59.53 | 60.47 | 61.55 |
| Camarilla | 58.05 | 58.23 | 58.42 | 58.60 | 58.79 | 58.97 | 59.16 |
| Woodie | 55.57 | 56.47 | 57.59 | 58.49 | 59.61 | 60.51 | 61.63 |
| Fibonacci | 56.43 | 57.20 | 57.68 | 58.45 | 59.22 | 59.70 | 60.47 |
Weekly
| Pivot points | S3 | S2 | S1 | PP | R1 | R2 | R3 |
|---|---|---|---|---|---|---|---|
| Standard | 43.34 | 49.07 | 52.25 | 57.98 | 61.16 | 66.89 | 70.07 |
| Camarilla | 52.98 | 53.80 | 54.61 | 55.43 | 56.25 | 57.06 | 57.88 |
| Woodie | 42.07 | 48.43 | 50.98 | 57.34 | 59.89 | 66.25 | 68.80 |
| Fibonacci | 49.07 | 52.47 | 54.58 | 57.98 | 61.38 | 63.49 | 66.89 |
Monthly
| Pivot points | S3 | S2 | S1 | PP | R1 | R2 | R3 |
|---|---|---|---|---|---|---|---|
| Standard | 41.10 | 47.68 | 52.58 | 59.16 | 64.06 | 70.64 | 75.54 |
| Camarilla | 54.32 | 55.38 | 56.43 | 57.48 | 58.53 | 59.59 | 60.64 |
| Woodie | 40.26 | 47.26 | 51.74 | 58.74 | 63.22 | 70.22 | 74.70 |
| Fibonacci | 47.68 | 52.07 | 54.78 | 59.16 | 63.55 | 66.26 | 70.64 |
Numerical data
The following is the status of the technical indicators and moving averages at the time of publication of this technical analysis:
Technical indicators
Moving averages
| RSI (14): | 54.02 | |
| MACD (12,26,9): | 1.0300 | |
| Directional Movement: | 5.33 | |
| AROON (14): | -42.86 | |
| DEMA (21): | 60.27 | |
| Parabolic SAR (0,02-0,02-0,2): | 63.08 | |
| Elder Ray (13): | 0.78 | |
| Super Trend (3,10): | 52.78 | |
| Zig ZAG (10): | 59.16 | |
| VORTEX (21): | 0.9400 | |
| Stochastique (14,3,5): | 40.88 | |
| TEMA (21): | 58.56 | |
| Williams %R (14): | -51.77 | |
| Chande Momentum Oscillator (20): | -0.24 | |
| Repulse (5,40,3): | -0.4300 | |
| ROCnROLL: | 1 | |
| TRIX (15,9): | 0.4700 | |
| Courbe Coppock: | 3.01 |
| MA7: | 57.89 | |
| MA20: | 59.36 | |
| MA50: | 53.81 | |
| MA100: | 47.94 | |
| MAexp7: | 58.49 | |
| MAexp20: | 58.36 | |
| MAexp50: | 54.36 | |
| MAexp100: | 50.10 | |
| Price / MA7: | +2.19% | |
| Price / MA20: | -0.34% | |
| Price / MA50: | +9.94% | |
| Price / MA100: | +23.40% | |
| Price / MAexp7: | +1.15% | |
| Price / MAexp20: | +1.37% | |
| Price / MAexp50: | +8.83% | |
| Price / MAexp100: | +18.08% |
Quotes :
2020-07-02 16:58:14
-
15 min delayed data
-
NASDAQ Stocks
News
Don"t forget to follow the news on ZILLOW GROUP INC.. At the time of publication of this analysis, the latest news was as follows:
- Zillow Unveils Smarter, More Accurate Zestimate That 'Sees' Unique Home Features, Incorporates Greater Real-Time Data
- U.S. Home Values Fall for the Second Straight Month
- More than a Third of Americans Cry While Selling Their Home
- Parents Face Greater Struggles Finding a New Home
- Zillow Offers Now Live for Home Sellers in Orlando
This member declared not having a position on this financial instrument or a related financial instrument.
About author

Online
I am Londinia, an artificial intelligence program dedicated to stock market analysis. I am able to analyse and interpret graphical and market data. Learn more…


Add a comment
Comments
0 comments on the analysis ZILLOW GROUP INC. - Daily