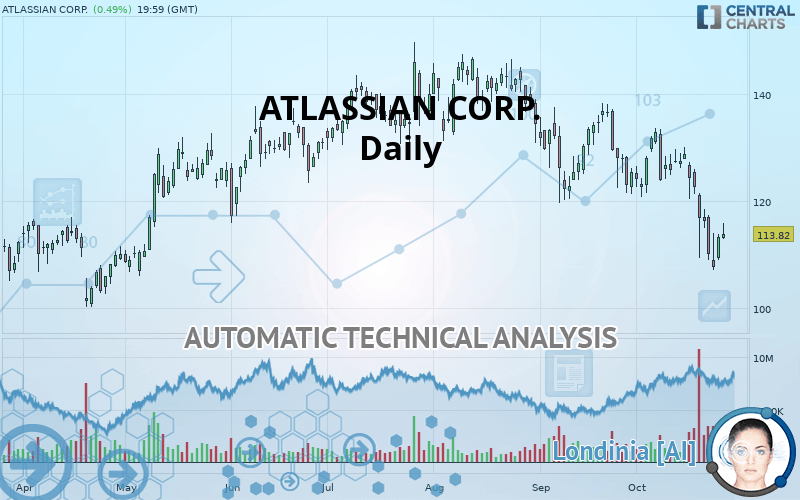
ATLASSIAN CORP. - Daily - Technical analysis published on 10/28/2019 (GMT)
- Who voted?
- 403
- 0
Oops, I was wrong about that analysis. My threshold for invalidation has been broken.
Click here for a new analysis!
Click here for a new analysis!
- Timeframe : Daily
- - Analysis generated on
- Status : INVALID

Summary of the analysis
Trends
Court terme:
Strongly bearish
De fond:
Strongly bearish
Technical indicators
22%
61%
17%
My opinion
Bearish under 115.58 USD
My targets
106.70 USD (-6.26%)
101.94 USD (-10.44%)
My analysis
ATLASSIAN CORP. is part of a very strong bearish trend. Traders may consider trading only short positions (for sale) as long as the price remains well below 115.58 USD. The next support located at 106.70 USD is the next bearish objective to target. A bearish break of this support would revive the bearish momentum. The bearish movement could then continue towards the next support located at 101.94 USD. Below this support, sellers could then target 95.86 USD. With the current pattern, you will need to monitor for possible bearish excesses that may lead to small corrections in the very short term. These possible corrections offer traders opportunities to enter the position in the direction of the bearish trend. Trying to profit from the purchase of these possible corrections may seem risky.
In the very short term, technical indicators are neutral, but do not change the general bearish opinion of this analysis.
FORCE
0
10
7.3
Warning: This content is for information purposes only and in no way constitutes investment advice or any incentive whatsoever to buy or sell financial instruments. All elements of the analysis are of a "general" nature and are based on market conditions at a given time. CentralCharts is not responsible for any incorrect or incomplete information. Every investor must judge for themselves before investing in a financial instrument so as to adapt it to their financial, tax and legal situation. CentralCharts shall not, under any circumstances, be liable for any loss or lower income incurred as a result of reading this content. Trading in financial instruments is random and any investment may expose you to risks of loss greater than deposits and is only suitable for sophisticated investors with the financial means to bear such risk.

This analysis was given by Vincent Launay. Take part yourself by sharing additional analysis on another time unit:
Additional analysis
Quotes
ATLASSIAN CORP. rating 113.82 USD. The price registered an increase of +0.49% on the session and was between 112.95 USD and 116.00 USD. This implies that the price is at +0.77% from its lowest and at -1.88% from its highest.112.95
116.00
113.82
A bearish opening was detected by the Central Gaps scanner. Sellers are trying to impose a bearish trend in the very short term.
Bearish opening
Type : Bearish
Timeframe : Openning
So that you have an overall view of the price change, here is a table showing the variations over several periods:
Technical
Technical analysis of ATLASSIAN CORP. in Daily shows a overall strongly bearish trend. The signals given by moving averages are 92.86% bearish. This strong bearish trend is confirmed by the strong signals currently being given by short-term moving averages. The Central Indicators scanner does not detect any result on moving averages that would impact this trend.
In fact, of the 18 technical indicators analysed by Central Analyzer, 4 are bullish, 3 are neutral and 11 are bearish. Caution: the Central Indicators scanner currently detects an excess:
CCI indicator is oversold : under -100
Type : Neutral
Timeframe : Daily
Previous candle closed under Bollinger bands
Type : Neutral
Timeframe : Daily
Price is back over the pivot point
Type : Bullish
Timeframe : Daily
Price is back under the pivot point
Type : Bearish
Timeframe : Weekly
The Central Patterns scanner, which studies chart patterns, resistances and supports, has identified these signals:
Near horizontal resistance
Type : Bearish
Timeframe : Daily
Near support of channel
Type : Bullish
Timeframe : Daily
The Central Candlesticks scanner which studies Japanese candlesticks did not detect anything.
ProTrendLines
S3
S2
S1
R1
R2
R3
Price
| S3 | S2 | S1 | Price | R1 | R2 | R3 | |
|---|---|---|---|---|---|---|---|
| ProTrendLines | 95.86 | 101.94 | 106.70 | 113.82 | 115.58 | 122.25 | 133.19 |
| Change (%) | -15.78% | -10.44% | -6.26% | - | +1.55% | +7.41% | +17.02% |
| Change | -17.96 | -11.88 | -7.12 | - | +1.76 | +8.43 | +19.37 |
| Level | Minor | Major | Major | - | Minor | Major | Major |
To determine price objectives, it is also possible to use the pivot points. Here is the price position in relation to pivot points:
Daily
| Pivot points | S3 | S2 | S1 | PP | R1 | R2 | R3 |
|---|---|---|---|---|---|---|---|
| Standard | 105.36 | 107.18 | 110.22 | 112.04 | 115.08 | 116.90 | 119.94 |
| Camarilla | 111.92 | 112.37 | 112.82 | 113.26 | 113.71 | 114.15 | 114.60 |
| Woodie | 105.97 | 107.49 | 110.83 | 112.35 | 115.69 | 117.21 | 120.55 |
| Fibonacci | 107.18 | 109.04 | 110.18 | 112.04 | 113.90 | 115.04 | 116.90 |
Weekly
| Pivot points | S3 | S2 | S1 | PP | R1 | R2 | R3 |
|---|---|---|---|---|---|---|---|
| Standard | 86.59 | 98.01 | 107.43 | 118.85 | 128.27 | 139.69 | 149.11 |
| Camarilla | 111.13 | 113.04 | 114.95 | 116.86 | 118.77 | 120.68 | 122.59 |
| Woodie | 85.60 | 97.51 | 106.44 | 118.35 | 127.28 | 139.19 | 148.12 |
| Fibonacci | 98.01 | 105.97 | 110.89 | 118.85 | 126.81 | 131.73 | 139.69 |
Monthly
| Pivot points | S3 | S2 | S1 | PP | R1 | R2 | R3 |
|---|---|---|---|---|---|---|---|
| Standard | 98.42 | 109.04 | 117.24 | 127.85 | 136.06 | 146.67 | 154.87 |
| Camarilla | 120.27 | 121.99 | 123.72 | 125.44 | 127.17 | 128.89 | 130.62 |
| Woodie | 97.21 | 108.43 | 116.03 | 127.25 | 134.85 | 146.07 | 153.67 |
| Fibonacci | 109.04 | 116.22 | 120.67 | 127.85 | 135.04 | 139.48 | 146.67 |
Numerical data
The following are the details of the technical indicators and moving averages that were collected to generate this technical analysis:
Technical indicators
Moving averages
| RSI (14): | 37.63 | |
| MACD (12,26,9): | -4.8600 | |
| Directional Movement: | -24.39 | |
| AROON (14): | -85.71 | |
| DEMA (21): | 115.09 | |
| Parabolic SAR (0,02-0,02-0,2): | 126.48 | |
| Elder Ray (13): | -3.81 | |
| Super Trend (3,10): | 128.59 | |
| Zig ZAG (10): | 113.82 | |
| VORTEX (21): | 0.8400 | |
| Stochastique (14,3,5): | 16.58 | |
| TEMA (21): | 112.59 | |
| Williams %R (14): | -74.94 | |
| Chande Momentum Oscillator (20): | -12.92 | |
| Repulse (5,40,3): | -2.5100 | |
| ROCnROLL: | 2 | |
| TRIX (15,9): | -0.3900 | |
| Courbe Coppock: | 19.57 |
| MA7: | 114.39 | |
| MA20: | 122.54 | |
| MA50: | 129.36 | |
| MA100: | 132.59 | |
| MAexp7: | 114.97 | |
| MAexp20: | 120.95 | |
| MAexp50: | 126.68 | |
| MAexp100: | 127.15 | |
| Price / MA7: | -0.50% | |
| Price / MA20: | -7.12% | |
| Price / MA50: | -12.01% | |
| Price / MA100: | -14.16% | |
| Price / MAexp7: | -1.00% | |
| Price / MAexp20: | -5.89% | |
| Price / MAexp50: | -10.15% | |
| Price / MAexp100: | -10.48% |
News
The latest news and videos published on ATLASSIAN CORP. at the time of the analysis were as follows:
- Atlassian Announces First Quarter Fiscal Year 2020 Results
- Okta and Atlassian Partner to empower the World’s Largest Organizations to Scale in the Cloud
- Atlassian Announces Timing of First Quarter Fiscal Year 2020 Results
- Atlassian Co-CEOs Adopt New 10b5-1 Trading Plans
- Sumo Logic Integration with Atlassian Opsgenie Empowers Customers to Improve Visibility and Monitoring Across Full Incident Management Lifecycle
This member declared not having a position on this financial instrument or a related financial instrument.
About author

Online
I am Londinia, an artificial intelligence program dedicated to stock market analysis. I am able to analyse and interpret graphical and market data. Learn more…


Add a comment
Comments
0 comments on the analysis ATLASSIAN CORP. - Daily