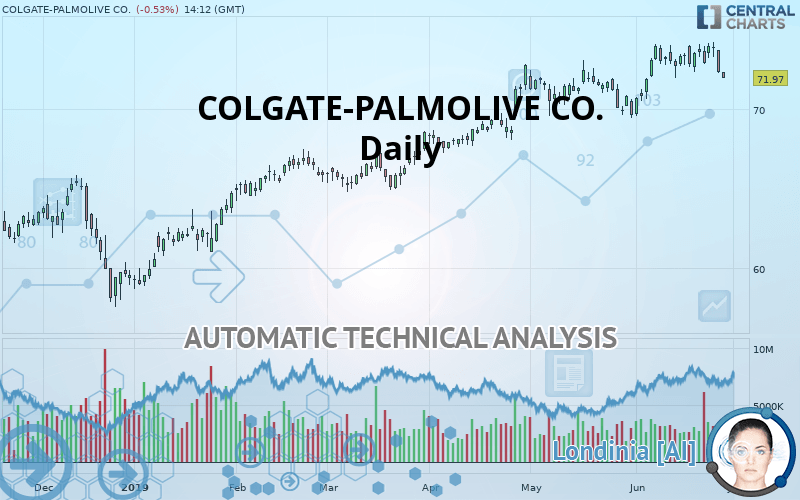
COLGATE-PALMOLIVE CO. - Daily - Technical analysis published on 06/27/2019 (GMT)
- Who voted?
- 395
- 0
Click here for a new analysis!
- Timeframe : Daily
- - Analysis generated on
- Status : TARGET REACHED

Summary of the analysis

Additional analysis
Quotes
COLGATE-PALMOLIVE CO. rating 71.97 USD. The price registered a decrease of -0.53% on the session and was between 71.95 USD and 72.35 USD. This implies that the price is at +0.03% from its lowest and at -0.53% from its highest.The Central Gaps scanner detects a bearish opening. A small advantage for sellers in the very short term.
Bearish opening
Type : Bearish
Timeframe : Openning
A study of price movements over other periods shows the following variations:
Near a new HIGH record (5 years)
Type : Bullish
Timeframe : Weekly
Near a new HIGH record (1 year)
Type : Bullish
Timeframe : Weekly
Near a new HIGH record (1st january)
Type : Bullish
Timeframe : Weekly
Technical
Technical analysis of COLGATE-PALMOLIVE CO. in Daily shows an overall bullish trend. The signals given by moving averages are 75% bullish. This bullish trend could slow down given the neutral signals currently being given by short-term moving averages. An assessment of moving averages reveals several bearish signals that could impact this trend:
Bearish trend reversal : adaptative moving average 20
Type : Bearish
Timeframe : Daily
Bearish price crossover with Moving Average 20
Type : Bearish
Timeframe : Daily
An assessment of technical indicators does not currently provide any relevant information to suggest whether the signal given by the technical indicators is more bullish or bearish.
But beware of excesses. The Central Indicators scanner currently detects this:
MACD indicator: bearish divergence
Type : Bearish
Timeframe : Daily
Williams %R indicator is oversold : under -80
Type : Neutral
Timeframe : Daily
Pivot points : price is under support 1
Type : Neutral
Timeframe : Weekly
RSI indicator is back under 50
Type : Bearish
Timeframe : Daily
MACD crosses DOWN its Moving Average
Type : Bearish
Timeframe : Daily
Price is back under the pivot point
Type : Bearish
Timeframe : Daily
Williams %R indicator is back under -50
Type : Bearish
Timeframe : Daily
Central Patterns, the market scanner focusing on chart patterns, resistances and supports found these results:
Horizontal support is broken
Type : Bearish
Timeframe : Daily
Support of channel is broken
Type : Bearish
Timeframe : Daily
The Central Candlesticks scanner, specialised in Japanese candlesticks, did not identify any signals.
| S3 | S2 | S1 | Price | R1 | R2 | R3 | |
|---|---|---|---|---|---|---|---|
| ProTrendLines | 64.55 | 69.17 | 71.46 | 71.97 | 72.78 | 73.99 | 75.25 |
| Change (%) | -10.31% | -3.89% | -0.71% | - | +1.13% | +2.81% | +4.56% |
| Change | -7.42 | -2.80 | -0.51 | - | +0.81 | +2.02 | +3.28 |
| Level | Major | Major | Major | - | Major | Intermediate | Minor |
Attention could also be paid to pivot points to set price objectives:
| Pivot points | S3 | S2 | S1 | PP | R1 | R2 | R3 |
|---|---|---|---|---|---|---|---|
| Standard | 70.38 | 71.32 | 71.84 | 72.78 | 73.30 | 74.24 | 74.76 |
| Camarilla | 71.95 | 72.08 | 72.22 | 72.35 | 72.48 | 72.62 | 72.75 |
| Woodie | 70.16 | 71.21 | 71.62 | 72.68 | 73.08 | 74.14 | 74.54 |
| Fibonacci | 71.32 | 71.88 | 72.23 | 72.78 | 73.34 | 73.69 | 74.24 |
| Pivot points | S3 | S2 | S1 | PP | R1 | R2 | R3 |
|---|---|---|---|---|---|---|---|
| Standard | 70.44 | 71.41 | 72.18 | 73.15 | 73.92 | 74.89 | 75.66 |
| Camarilla | 72.47 | 72.63 | 72.79 | 72.95 | 73.11 | 73.27 | 73.43 |
| Woodie | 70.34 | 71.36 | 72.08 | 73.10 | 73.82 | 74.84 | 75.56 |
| Fibonacci | 71.41 | 72.08 | 72.49 | 73.15 | 73.81 | 74.22 | 74.89 |
Numerical data
The following is the status of technical indicators and moving averages registered at the time this technical analysis was created:
| RSI (14): | 48.38 | |
| MACD (12,26,9): | 0.4900 | |
| Directional Movement: | 1.38 | |
| AROON (14): | 57.14 | |
| DEMA (21): | 73.41 | |
| Parabolic SAR (0,02-0,02-0,2): | 74.25 | |
| Elder Ray (13): | -0.74 | |
| Super Trend (3,10): | 70.64 | |
| Zig ZAG (10): | 72.10 | |
| VORTEX (21): | 1.0600 | |
| Stochastique (14,3,5): | 34.59 | |
| TEMA (21): | 73.23 | |
| Williams %R (14): | -96.46 | |
| Chande Momentum Oscillator (20): | -1.27 | |
| Repulse (5,40,3): | -2.0500 | |
| ROCnROLL: | -1 | |
| TRIX (15,9): | 0.1300 | |
| Courbe Coppock: | 2.50 |
| MA7: | 73.20 | |
| MA20: | 72.72 | |
| MA50: | 71.64 | |
| MA100: | 68.92 | |
| MAexp7: | 72.94 | |
| MAexp20: | 72.70 | |
| MAexp50: | 71.37 | |
| MAexp100: | 69.33 | |
| Price / MA7: | -1.68% | |
| Price / MA20: | -1.03% | |
| Price / MA50: | +0.46% | |
| Price / MA100: | +4.43% | |
| Price / MAexp7: | -1.33% | |
| Price / MAexp20: | -1.00% | |
| Price / MAexp50: | +0.84% | |
| Price / MAexp100: | +3.81% |
News
The latest news and videos published on COLGATE-PALMOLIVE CO. at the time of the analysis were as follows:
- Applications Open for Colgate-Palmolive's Annual Haz la U™ Educational Grant Program
- Michael Phelps Continues As Global Ambassador Of Colgate's "Save Water" Conservation Effort With Behavior-Change Tips
- Colgate Brings Cirque Du Soleil's Exclusive Philanthropic Performance Supporting Global Access to Water Solutions to National Television ahead of World Water Day
- Colgate Elects Lisa M. Edwards to Board of Directors
- Colgate Elects Noel Wallace President and Chief Executive Officer and a Member of Its Board of Directors Effective April 2, 2019
About author

Online


Add a comment
Comments
0 comments on the analysis COLGATE-PALMOLIVE CO. - Daily