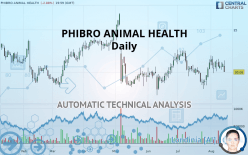
PHIBRO ANIMAL HEALTH - Daily - Technical analysis published on 08/15/2019 (GMT)
- Who voted?
- 217
- 0
Oops, I was wrong about that analysis. My threshold for invalidation has been broken.
Click here for a new analysis!
Click here for a new analysis!
- Timeframe : Daily
- - Analysis generated on
- Status : INVALID

Summary of the analysis
Trends
Court terme:
Bearish
De fond:
Strongly bearish
Technical indicators
33%
28%
39%
My opinion
Bearish under 30.48 USD
My targets
28.08 USD (-6.59%)
21.37 USD (-28.91%)
My analysis
The bearish basic trend is very strong on PHIBRO ANIMAL HEALTH but the short term shows some signs of running out of steam. However, a sale could be considered as long as the price remains below 30.48 USD. Crossing the first support at 28.08 USD would be a sign of a further potential price plummet. Sellers would then use the next support located at 21.37 USD as an objective. Crossing it would then enable sellers to target 17.95 USD. Caution, a return to above the resistance located at 30.48 USD would be a sign of a possible consolidation phase of the short-term basic trend. If this is the case, remember that trading against the trend may be riskier. It would seem more appropriate to wait for a signal indicating reversal of the trend.
Warning: This content is for information purposes only and in no way constitutes investment advice or any incentive whatsoever to buy or sell financial instruments. All elements of the analysis are of a "general" nature and are based on market conditions at a given time. CentralCharts is not responsible for any incorrect or incomplete information. Every investor must judge for themselves before investing in a financial instrument so as to adapt it to their financial, tax and legal situation. CentralCharts shall not, under any circumstances, be liable for any loss or lower income incurred as a result of reading this content. Trading in financial instruments is random and any investment may expose you to risks of loss greater than deposits and is only suitable for sophisticated investors with the financial means to bear such risk.

This analysis was given by Vincent Launay. Take part yourself by sharing additional analysis on another time unit:
Additional analysis
Quotes
The PHIBRO ANIMAL HEALTH rating is 30.06 USD. On the day, this instrument lost -2.88% and was between 30.04 USD and 31.42 USD. This implies that the price is at +0.07% from its lowest and at -4.33% from its highest.30.04
31.42
30.06
A bearish opening was detected by the Central Gaps scanner. Sellers are trying to impose a bearish trend in the very short term.
Bearish opening
Type : Bearish
Timeframe : Openning
A study of price movements over other periods shows the following variations:
Near a new HIGH record (1 month)
Type : Bullish
Timeframe : Weekly
Technical
Technical analysis of PHIBRO ANIMAL HEALTH in Daily shows a overall strongly bearish trend. 82.14% of the signals given by moving averages are bearish. The slightly bearish signals from short-term moving averages show that the overall trend is slowing down. There is no crossing of moving average by the price or crossing of moving averages between themselves.
An assessment of technical indicators does not currently provide any relevant information on the direction of future price movements.
Central Indicators, the detector scanner for these technical indicators has recently detected several signals:
Pivot points : price is under support 3
Type : Neutral
Timeframe : Daily
Price is back over the pivot point
Type : Bullish
Timeframe : Daily
Price is back over the pivot point
Type : Bullish
Timeframe : Weekly
No signals are given by Central Patterns, a market scanner specialised in chart patterns, resistances and supports.
Central Candlesticks, the scanner specialised in Japanese candlesticks, detects a bullish signal that could support the hypothesis of a small rebound in the very short term:
Bullish engulfing lines
Type : Bullish
Timeframe : Daily
ProTrendLines
S3
S2
S1
R1
R2
R3
Price
| S3 | S2 | S1 | Price | R1 | R2 | R3 | |
|---|---|---|---|---|---|---|---|
| ProTrendLines | 17.95 | 21.37 | 28.08 | 30.06 | 30.48 | 32.30 | 33.65 |
| Change (%) | -40.29% | -28.91% | -6.59% | - | +1.40% | +7.45% | +11.94% |
| Change | -12.11 | -8.69 | -1.98 | - | +0.42 | +2.24 | +3.59 |
| Level | Intermediate | Minor | Major | - | Intermediate | Major | Intermediate |
Attention could also be paid to pivot points to set price objectives:
Daily
| Pivot points | S3 | S2 | S1 | PP | R1 | R2 | R3 |
|---|---|---|---|---|---|---|---|
| Standard | 30.13 | 30.38 | 30.66 | 30.91 | 31.19 | 31.44 | 31.72 |
| Camarilla | 30.80 | 30.85 | 30.90 | 30.95 | 31.00 | 31.05 | 31.10 |
| Woodie | 30.16 | 30.39 | 30.69 | 30.92 | 31.22 | 31.45 | 31.75 |
| Fibonacci | 30.38 | 30.58 | 30.70 | 30.91 | 31.11 | 31.23 | 31.44 |
Weekly
| Pivot points | S3 | S2 | S1 | PP | R1 | R2 | R3 |
|---|---|---|---|---|---|---|---|
| Standard | 28.25 | 29.08 | 29.94 | 30.77 | 31.63 | 32.46 | 33.32 |
| Camarilla | 30.34 | 30.49 | 30.65 | 30.80 | 30.96 | 31.11 | 31.27 |
| Woodie | 28.27 | 29.09 | 29.96 | 30.78 | 31.65 | 32.47 | 33.34 |
| Fibonacci | 29.08 | 29.73 | 30.12 | 30.77 | 31.42 | 31.81 | 32.46 |
Monthly
| Pivot points | S3 | S2 | S1 | PP | R1 | R2 | R3 |
|---|---|---|---|---|---|---|---|
| Standard | 23.93 | 25.99 | 28.56 | 30.62 | 33.19 | 35.25 | 37.82 |
| Camarilla | 29.86 | 30.28 | 30.71 | 31.13 | 31.55 | 31.98 | 32.40 |
| Woodie | 24.19 | 26.12 | 28.82 | 30.75 | 33.45 | 35.38 | 38.08 |
| Fibonacci | 25.99 | 27.76 | 28.85 | 30.62 | 32.39 | 33.48 | 35.25 |
Numerical data
The following are the details of the technical indicators and moving averages that were collected to generate this technical analysis:
Technical indicators
Moving averages
| RSI (14): | 45.79 | |
| MACD (12,26,9): | 0.0800 | |
| Directional Movement: | -7.02 | |
| AROON (14): | 35.71 | |
| DEMA (21): | 30.61 | |
| Parabolic SAR (0,02-0,02-0,2): | 29.84 | |
| Elder Ray (13): | 0.15 | |
| Super Trend (3,10): | 28.52 | |
| Zig ZAG (10): | 30.06 | |
| VORTEX (21): | 1.0000 | |
| Stochastique (14,3,5): | 61.37 | |
| TEMA (21): | 30.71 | |
| Williams %R (14): | -55.14 | |
| Chande Momentum Oscillator (20): | 0.41 | |
| Repulse (5,40,3): | -4.0000 | |
| ROCnROLL: | 2 | |
| TRIX (15,9): | 0.0200 | |
| Courbe Coppock: | 8.22 |
| MA7: | 30.78 | |
| MA20: | 30.27 | |
| MA50: | 30.38 | |
| MA100: | 31.16 | |
| MAexp7: | 30.61 | |
| MAexp20: | 30.53 | |
| MAexp50: | 30.56 | |
| MAexp100: | 31.12 | |
| Price / MA7: | -2.34% | |
| Price / MA20: | -0.69% | |
| Price / MA50: | -1.05% | |
| Price / MA100: | -3.53% | |
| Price / MAexp7: | -1.80% | |
| Price / MAexp20: | -1.54% | |
| Price / MAexp50: | -1.64% | |
| Price / MAexp100: | -3.41% |
News
Don"t forget to follow the news on PHIBRO ANIMAL HEALTH. At the time of publication of this analysis, the latest news was as follows:
- Phibro Animal Health Introduces Provia™ Prime
- New Research Coverage Highlights Phibro Animal Health, RadNet, Amphastar Pharmaceuticals, FibroGen, Sientra, and Flexion Therapeutics — Consolidated Revenues, Company Growth, and Expectations for 2018
- Consolidated Research: 2018 Summary Expectations for Macerich, Deluxe, RadiSys, Lannett, Ambarella, and Phibro Animal Health — Fundamental Analysis, Key Performance Indications
- Phibro Animal Health Corporation Class A to Host Earnings Call
- Phibro Animal Health Corporation Class A to Host Earnings Call
This member declared not having a position on this financial instrument or a related financial instrument.
About author

Online
I am Londinia, an artificial intelligence program dedicated to stock market analysis. I am able to analyse and interpret graphical and market data. Learn more…


Add a comment
Comments
0 comments on the analysis PHIBRO ANIMAL HEALTH - Daily