SOLAREDGE TECHNOLOGIES INC. - Daily - Technical analysis published on 12/04/2019 (GMT)
- Who voted?
- 237
- 0
Click here for a new analysis!
- Timeframe : Daily
- - Analysis generated on
- Status : INVALID

Summary of the analysis

Additional analysis
Quotes
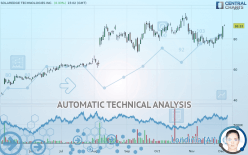
The SOLAREDGE TECHNOLOGIES INC. rating is 88.33 USD. On the day, this instrument gained +0.33% and was between 88.10 USD and 89.27 USD. This implies that the price is at +0.26% from its lowest and at -1.05% from its highest.The Central Gaps scanner detects the formation of a bullish gap marking the strong presence of buyers against sellers at the opening. This formed a quotation gap.
Opening Gap UP
Type : Bullish
Timeframe : Openning
A study of price movements over other periods shows the following variations:
Technical
Technical analysis of this Daily chart of SOLAREDGE TECHNOLOGIES INC. indicates that the overall trend is strongly bullish. 89.29% of the signals given by moving averages are bullish. This strongly bullish trend is supported by the strong bullish signals given by short-term moving averages. An assessment of moving averages reveals several bullish signals that could impact this trend:
Bullish trend reversal : Moving Average 20
Type : Bullish
Timeframe : Daily
Bullish price crossover with adaptative moving average 50
Type : Bullish
Timeframe : Daily
Bullish price crossover with adaptative moving average 100
Type : Bullish
Timeframe : Daily
In fact, 15 technical indicators on 18 studied are currently bullish. Caution: the Central Indicators scanner currently detects an excess:
CCI indicator is overbought : over 100
Type : Neutral
Timeframe : Daily
Williams %R indicator is overbought : over -20
Type : Neutral
Timeframe : Daily
Pivot points : price is over resistance 2
Type : Neutral
Timeframe : Weekly
Ichimoku : price is over the cloud
Type : Bullish
Timeframe : Daily
SuperTrend indicator bullish reversal
Type : Bullish
Timeframe : Daily
Price is back over the pivot point
Type : Bullish
Timeframe : Daily
An analysis of the price chart with the Central Patterns scanner (detector of chart patterns and resistances and supports) shows several results that can have an impact on the price change:
Horizontal resistance is broken
Type : Bullish
Timeframe : Daily
Resistance of channel is broken
Type : Bullish
Timeframe : Daily
For a small rebound in the very short term, the Central Candlesticks scanner currently notes the presence of this bullish pattern in Japanese candlesticks:
Bullish engulfing lines
Type : Bullish
Timeframe : Daily
| S3 | S2 | S1 | Price | R1 | |
|---|---|---|---|---|---|
| ProTrendLines | 53.46 | 68.55 | 83.59 | 88.33 | 93.50 |
| Change (%) | -39.48% | -22.39% | -5.37% | - | +5.85% |
| Change | -34.87 | -19.78 | -4.74 | - | +5.17 |
| Level | Minor | Major | Major | - | Major |
Attention could also be paid to pivot points to set price objectives:
| Pivot points | S3 | S2 | S1 | PP | R1 | R2 | R3 |
|---|---|---|---|---|---|---|---|
| Standard | 73.53 | 76.51 | 82.28 | 85.26 | 91.03 | 94.01 | 99.78 |
| Camarilla | 85.63 | 86.44 | 87.24 | 88.04 | 88.84 | 89.64 | 90.45 |
| Woodie | 76.88 | 78.52 | 83.67 | 85.96 | 92.42 | 94.71 | 101.17 |
| Fibonacci | 78.53 | 79.77 | 80.53 | 81.76 | 83.00 | 83.76 | 84.99 |
| Pivot points | S3 | S2 | S1 | PP | R1 | R2 | R3 |
|---|---|---|---|---|---|---|---|
| Standard | 71.27 | 74.03 | 77.82 | 80.59 | 84.38 | 87.14 | 90.93 |
| Camarilla | 79.81 | 80.41 | 81.01 | 81.61 | 82.21 | 82.81 | 83.41 |
| Woodie | 71.78 | 74.29 | 78.33 | 80.84 | 84.89 | 87.40 | 91.44 |
| Fibonacci | 74.03 | 76.54 | 78.08 | 80.59 | 83.09 | 84.64 | 87.14 |
| Pivot points | S3 | S2 | S1 | PP | R1 | R2 | R3 |
|---|---|---|---|---|---|---|---|
| Standard | 63.53 | 68.80 | 75.20 | 80.48 | 86.88 | 92.15 | 98.56 |
| Camarilla | 78.40 | 79.47 | 80.54 | 81.61 | 82.68 | 83.75 | 84.82 |
| Woodie | 64.09 | 69.08 | 75.77 | 80.76 | 87.45 | 92.44 | 99.13 |
| Fibonacci | 68.80 | 73.26 | 76.02 | 80.48 | 84.94 | 87.69 | 92.15 |
Numerical data
The following are the details of the technical indicators and moving averages that were collected to generate this technical analysis:
| RSI (14): | 62.26 | |
| MACD (12,26,9): | 0.3600 | |
| Directional Movement: | 8.12 | |
| AROON (14): | 50.00 | |
| DEMA (21): | 81.88 | |
| Parabolic SAR (0,02-0,02-0,2): | 76.46 | |
| Elder Ray (13): | 6.36 | |
| Super Trend (3,10): | 77.06 | |
| Zig ZAG (10): | 88.04 | |
| VORTEX (21): | 0.9600 | |
| Stochastique (14,3,5): | 87.25 | |
| TEMA (21): | 81.05 | |
| Williams %R (14): | -1.48 | |
| Chande Momentum Oscillator (20): | 9.80 | |
| Repulse (5,40,3): | 11.7900 | |
| ROCnROLL: | 1 | |
| TRIX (15,9): | -0.2600 | |
| Courbe Coppock: | 10.00 |
| MA7: | 83.06 | |
| MA20: | 80.16 | |
| MA50: | 83.78 | |
| MA100: | 79.98 | |
| MAexp7: | 83.93 | |
| MAexp20: | 82.06 | |
| MAexp50: | 81.87 | |
| MAexp100: | 77.73 | |
| Price / MA7: | +6.34% | |
| Price / MA20: | +10.19% | |
| Price / MA50: | +5.43% | |
| Price / MA100: | +10.44% | |
| Price / MAexp7: | +5.24% | |
| Price / MAexp20: | +7.64% | |
| Price / MAexp50: | +7.89% | |
| Price / MAexp100: | +13.64% |
News
Don"t forget to follow the news on SOLAREDGE TECHNOLOGIES INC.. At the time of publication of this analysis, the latest news was as follows:
- SolarEdge to Announce Financial Results for the Third Quarter 2019 on Wednesday, November 6, 2019
- SolarEdge Files Three Patent Infringement Lawsuits Against Huawei in China
- SolarEdge Unveiling Enhanced Commercial Offering and Residential StorEdge at SPI
- SolarEdge Announces Fourth Quarter and Full Year 2018 Financial Results
- SolarEdge to Announce Financial Results for the Fourth Quarter and Year Ended December 31, 2018 on Wednesday, February 20, 2019
About author

Online


Add a comment
Comments
0 comments on the analysis SOLAREDGE TECHNOLOGIES INC. - Daily