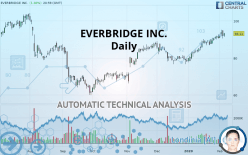
EVERBRIDGE INC. - Daily - Technical analysis published on 02/07/2020 (GMT)
- Who voted?
- 288
- 0
Click here for a new analysis!
- Timeframe : Daily
- - Analysis generated on
- Status : TARGET REACHED

Summary of the analysis

Additional analysis
Quotes
The EVERBRIDGE INC. price is 93.11 USD. The price registered an increase of +1.38% on the session and was between 91.34 USD and 93.47 USD. This implies that the price is at +1.94% from its lowest and at -0.39% from its highest.A bullish opening was detected by the Central Gaps scanner. Buyers are trying to impose a bullish momentum in the very short term.
Bullish opening
Type : Bullish
Timeframe : Openning
A study of price movements over other periods shows the following variations:
Near a new HIGH record (1st january)
Type : Bullish
Timeframe : Weekly
Near a new HIGH record (1 month)
Type : Bullish
Timeframe : Weekly
Technical
A technical analysis in Daily of this EVERBRIDGE INC. chart shows a strongly bullish trend. 92.86% of the signals given by moving averages are bullish. This strongly bullish trend is supported by the strong bullish signals given by short-term moving averages. The Central Indicators scanner does not detect any result on moving averages that would impact this trend.
In fact, according to the parameters integrated into the Central Analyzer system, 13 technical indicators out of 18 analysed are currently bullish. Caution: the Central Indicators scanner currently detects an excess:
CCI indicator is overbought : over 100
Type : Neutral
Timeframe : Daily
RSI indicator: bearish divergence
Type : Bearish
Timeframe : Daily
Williams %R indicator is overbought : over -20
Type : Neutral
Timeframe : Daily
Pivot points : price is over resistance 1
Type : Neutral
Timeframe : Weekly
Parabolic SAR indicator bearish reversal
Type : Bearish
Timeframe : Daily
Price is back under the pivot point
Type : Bearish
Timeframe : Daily
The Central Patterns scanner, which studies chart patterns, resistances and supports, has identified this signal:
Resistance of channel is broken
Type : Bullish
Timeframe : Daily
The presence of a bearish pattern in Japanese candlesticks detected by Central Candlesticks that could cause a correction in the very short term was also detected:
Bearish engulfing lines
Type : Bearish
Timeframe : Daily
| S3 | S2 | S1 | Price | R1 | R2 | |
|---|---|---|---|---|---|---|
| ProTrendLines | 67.31 | 78.12 | 87.94 | 93.11 | 97.04 | 103.23 |
| Change (%) | -27.71% | -16.10% | -5.55% | - | +4.22% | +10.87% |
| Change | -25.80 | -14.99 | -5.17 | - | +3.93 | +10.12 |
| Level | Minor | Intermediate | Major | - | Minor | Major |
To determine price objectives, it is also possible to use the pivot points. Here is the price position in relation to pivot points:
| Pivot points | S3 | S2 | S1 | PP | R1 | R2 | R3 |
|---|---|---|---|---|---|---|---|
| Standard | 85.59 | 88.05 | 89.95 | 92.41 | 94.31 | 96.77 | 98.67 |
| Camarilla | 90.64 | 91.04 | 91.44 | 91.84 | 92.24 | 92.64 | 93.04 |
| Woodie | 85.30 | 87.91 | 89.66 | 92.27 | 94.02 | 96.63 | 98.38 |
| Fibonacci | 88.05 | 89.72 | 90.75 | 92.41 | 94.08 | 95.11 | 96.77 |
| Pivot points | S3 | S2 | S1 | PP | R1 | R2 | R3 |
|---|---|---|---|---|---|---|---|
| Standard | 83.10 | 85.44 | 88.04 | 90.38 | 92.98 | 95.32 | 97.92 |
| Camarilla | 89.28 | 89.74 | 90.19 | 90.64 | 91.09 | 91.55 | 92.00 |
| Woodie | 83.23 | 85.51 | 88.17 | 90.44 | 93.11 | 95.38 | 98.05 |
| Fibonacci | 85.44 | 87.33 | 88.49 | 90.38 | 92.27 | 93.43 | 95.32 |
| Pivot points | S3 | S2 | S1 | PP | R1 | R2 | R3 |
|---|---|---|---|---|---|---|---|
| Standard | 66.14 | 71.87 | 81.25 | 86.99 | 96.37 | 102.10 | 111.49 |
| Camarilla | 86.48 | 87.87 | 89.25 | 90.64 | 92.03 | 93.41 | 94.80 |
| Woodie | 67.96 | 72.78 | 83.08 | 87.90 | 98.20 | 103.02 | 113.32 |
| Fibonacci | 71.87 | 77.64 | 81.21 | 86.99 | 92.76 | 96.33 | 102.10 |
Numerical data
The following is the status of technical indicators and moving averages registered at the time this technical analysis was created:
| RSI (14): | 66.85 | |
| MACD (12,26,9): | 2.6300 | |
| Directional Movement: | 14.43 | |
| AROON (14): | 71.42 | |
| DEMA (21): | 92.51 | |
| Parabolic SAR (0,02-0,02-0,2): | 95.16 | |
| Elder Ray (13): | 1.84 | |
| Super Trend (3,10): | 86.47 | |
| Zig ZAG (10): | 93.11 | |
| VORTEX (21): | 1.2000 | |
| Stochastique (14,3,5): | 74.56 | |
| TEMA (21): | 93.56 | |
| Williams %R (14): | -24.33 | |
| Chande Momentum Oscillator (20): | 5.36 | |
| Repulse (5,40,3): | 0.4000 | |
| ROCnROLL: | 1 | |
| TRIX (15,9): | 0.4100 | |
| Courbe Coppock: | 12.90 |
| MA7: | 91.99 | |
| MA20: | 89.00 | |
| MA50: | 84.84 | |
| MA100: | 78.55 | |
| MAexp7: | 91.89 | |
| MAexp20: | 89.16 | |
| MAexp50: | 85.34 | |
| MAexp100: | 82.64 | |
| Price / MA7: | +1.22% | |
| Price / MA20: | +4.62% | |
| Price / MA50: | +9.75% | |
| Price / MA100: | +18.54% | |
| Price / MAexp7: | +1.33% | |
| Price / MAexp20: | +4.43% | |
| Price / MAexp50: | +9.10% | |
| Price / MAexp100: | +12.67% |
News
The latest news and videos published on EVERBRIDGE INC. at the time of the analysis were as follows:
- Everbridge Appoints Finastra CEO Simon Paris to its Board of Directors
- City of Miami Deploys Everbridge to Keep Locals and Visitors Safe During This Sunday’s Big Game
- Fusion Risk Management Launches Fusion Connector for Everbridge Risk Intelligence
- Everbridge Named Top Enterprise IT Alerting and Incident Management Solution of 2019 by IT Central Station
- Everbridge to Announce Fourth Quarter and Full Year 2019 Financial Results on February 18, 2020
About author

Online


Add a comment
Comments
0 comments on the analysis EVERBRIDGE INC. - Daily