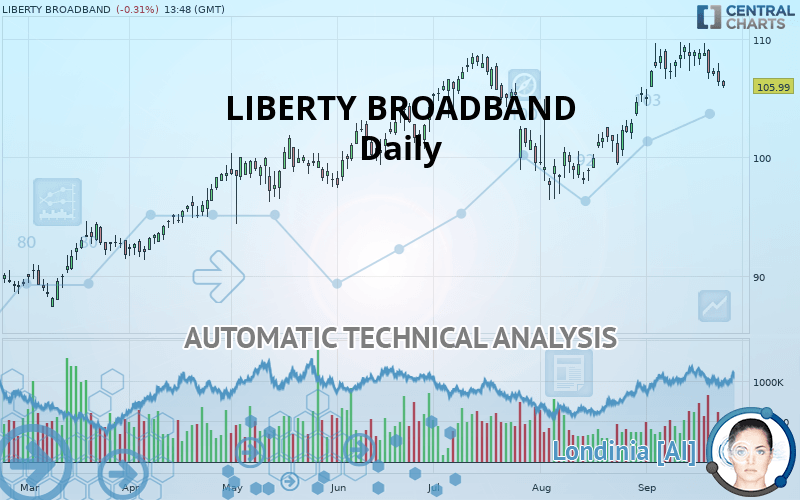
LIBERTY BROADBAND - Daily - Technical analysis published on 09/25/2019 (GMT)
- Who voted?
- 290
- 0
I am delighted to see that my first price objective has been achieved. I hope you've taken advantage of it.
Click here for a new analysis!
Click here for a new analysis!
- Timeframe : Daily
- - Analysis generated on
- Status : TARGET REACHED

Summary of the analysis
Trends
Court terme:
Neutral
De fond:
Bullish
Technical indicators
17%
39%
44%
My opinion
Bullish above 103.55 USD
My targets
108.49 USD (+2.36%)
My analysis
We are currently in a phase of short-term indecision. In a case like this, you could favour trades in the direction of the basic trend on LIBERTY BROADBAND. As long as you are above the support located at 103.55 USD, traders with an aggressive trading strategy could consider a purchase. A cross of the resistance located at 108.49 USD would be a signal that the basic trade will reverse and the short-term trend could then quickly become bullish. If the support 103.55 USD were to be broken, this would simply be a sign of a possible continuation of short-term consolidation and trading against the trend would then perhaps be more risky.
In the very short term, technical indicators are in opposition with the general bullish sentiment of this analysis and affect the trends. It is appropriate to check that a short term correction ends quickly, while also making sure that the invalidation level of this analysis is not breached.
FORCE
0
10
1.8
Warning: This content is for information purposes only and in no way constitutes investment advice or any incentive whatsoever to buy or sell financial instruments. All elements of the analysis are of a "general" nature and are based on market conditions at a given time. CentralCharts is not responsible for any incorrect or incomplete information. Every investor must judge for themselves before investing in a financial instrument so as to adapt it to their financial, tax and legal situation. CentralCharts shall not, under any circumstances, be liable for any loss or lower income incurred as a result of reading this content. Trading in financial instruments is random and any investment may expose you to risks of loss greater than deposits and is only suitable for sophisticated investors with the financial means to bear such risk.

This analysis was given by Vincent Launay. Take part yourself by sharing additional analysis on another time unit:
Additional analysis
Quotes
The LIBERTY BROADBAND rating is 105.99 USD. The price registered a decrease of -0.31% on the session with the lowest point at 105.88 USD and the highest point at 106.48 USD. The deviation from the price is +0.10% for the low point and -0.46% for the high point.105.88
106.48
105.99
The Central Gaps scanner detects a bullish opening marking the presence of buyers ahead of sellers at the opening but not sufficiently marked to allow the price to register a quotation gap.
Bullish opening
Type : Bullish
Timeframe : Openning
A study of price movements over other periods shows the following variations:
Near a new HIGH record (5 years)
Type : Bullish
Timeframe : Weekly
Near a new HIGH record (1 year)
Type : Bullish
Timeframe : Weekly
Near a new HIGH record (1st january)
Type : Bullish
Timeframe : Weekly
Near a new HIGH record (1 month)
Type : Bullish
Timeframe : Weekly
Technical
A technical analysis in Daily of this LIBERTY BROADBAND chart shows a bullish trend. 67.86% of the signals given by moving averages are bullish. Caution: the neutral signals currently given by short-term moving averages show us that the global trend is losing momentum. The Central Indicators scanner does not detect any result on moving averages that would impact this trend.
In fact, according to the parameters integrated into the Central Analyzer system, only 7 technical indicators out of 18 analysed are currently bearish. Central Indicators, the scanner specialised in technical indicators, has identified these signals:
Price is back under the pivot point
Type : Bearish
Timeframe : Daily
Price is back under the pivot point
Type : Bearish
Timeframe : Weekly
Williams %R indicator is back under -50
Type : Bearish
Timeframe : Daily
The analysis of the price chart with Central Patterns scanners does not return any result.
The Central Candlesticks scanner which studies Japanese candlesticks did not detect anything.
ProTrendLines
S3
S2
S1
R1
Price
| S3 | S2 | S1 | Price | R1 | |
|---|---|---|---|---|---|
| ProTrendLines | 91.79 | 97.56 | 103.55 | 105.99 | 108.49 |
| Change (%) | -13.40% | -7.95% | -2.30% | - | +2.36% |
| Change | -14.20 | -8.43 | -2.44 | - | +2.50 |
| Level | Minor | Major | Major | - | Major |
To determine price objectives, it is also possible to use the pivot points. Here is the price position in relation to pivot points:
Daily
| Pivot points | S3 | S2 | S1 | PP | R1 | R2 | R3 |
|---|---|---|---|---|---|---|---|
| Standard | 103.66 | 104.83 | 105.58 | 106.75 | 107.50 | 108.67 | 109.42 |
| Camarilla | 105.79 | 105.97 | 106.14 | 106.32 | 106.50 | 106.67 | 106.85 |
| Woodie | 106.00 | 106.42 | 106.67 | 107.09 | 107.34 | 107.76 | 108.01 |
| Fibonacci | 106.45 | 106.71 | 106.87 | 107.12 | 107.38 | 107.54 | 107.79 |
Weekly
| Pivot points | S3 | S2 | S1 | PP | R1 | R2 | R3 |
|---|---|---|---|---|---|---|---|
| Standard | 102.88 | 104.74 | 105.92 | 107.78 | 108.96 | 110.82 | 112.00 |
| Camarilla | 106.25 | 106.53 | 106.81 | 107.09 | 107.37 | 107.65 | 107.93 |
| Woodie | 102.53 | 104.57 | 105.57 | 107.61 | 108.61 | 110.65 | 111.65 |
| Fibonacci | 104.74 | 105.91 | 106.62 | 107.78 | 108.95 | 109.66 | 110.82 |
Monthly
| Pivot points | S3 | S2 | S1 | PP | R1 | R2 | R3 |
|---|---|---|---|---|---|---|---|
| Standard | 89.75 | 93.09 | 99.27 | 102.61 | 108.79 | 112.13 | 118.31 |
| Camarilla | 102.82 | 103.70 | 104.57 | 105.44 | 106.31 | 107.19 | 108.06 |
| Woodie | 91.16 | 93.80 | 100.68 | 103.32 | 110.20 | 112.84 | 119.72 |
| Fibonacci | 93.09 | 96.73 | 98.98 | 102.61 | 106.25 | 108.50 | 112.13 |
Numerical data
The following is the status of the technical indicators and moving averages at the time of publication of this technical analysis:
Technical indicators
Moving averages
| RSI (14): | 50.72 | |
| MACD (12,26,9): | 1.0800 | |
| Directional Movement: | 0.98 | |
| AROON (14): | 35.71 | |
| DEMA (21): | 108.39 | |
| Parabolic SAR (0,02-0,02-0,2): | 109.60 | |
| Elder Ray (13): | -0.31 | |
| Super Trend (3,10): | 103.95 | |
| Zig ZAG (10): | 106.32 | |
| VORTEX (21): | 1.1100 | |
| Stochastique (14,3,5): | 29.21 | |
| TEMA (21): | 108.82 | |
| Williams %R (14): | -91.64 | |
| Chande Momentum Oscillator (20): | -2.18 | |
| Repulse (5,40,3): | -2.4300 | |
| ROCnROLL: | -1 | |
| TRIX (15,9): | 0.2300 | |
| Courbe Coppock: | 4.74 |
| MA7: | 107.53 | |
| MA20: | 107.19 | |
| MA50: | 103.77 | |
| MA100: | 102.82 | |
| MAexp7: | 107.07 | |
| MAexp20: | 106.57 | |
| MAexp50: | 104.65 | |
| MAexp100: | 101.95 | |
| Price / MA7: | -1.43% | |
| Price / MA20: | -1.12% | |
| Price / MA50: | +2.14% | |
| Price / MA100: | +3.08% | |
| Price / MAexp7: | -1.01% | |
| Price / MAexp20: | -0.54% | |
| Price / MAexp50: | +1.28% | |
| Price / MAexp100: | +3.96% |
News
The last news published on LIBERTY BROADBAND at the time of the generation of this analysis was as follows:
- New Research Coverage Highlights Spire, Liberty Broadband, Zillow Group, Ritchie Bros. Auctioneers, GCP Applied Technologies, and Itron — Consolidated Revenues, Company Growth, and Expectations for 2019
- Investor Expectations to Drive Momentum within Lawson Products, Kingold Jewelry, Liberty Broadband, Mustang Bio, Artesian Resources, and MYnd Analytics — Discovering Underlying Factors of Influence
- Market Trends Toward New Normal in Endologix, Sanmina, First American Financial, Expeditors International of Washington, Liberty Broadband, and Nu Skin Enterprises — Emerging Consolidated Expectations, Analyst Ratings
-
 Liberty Broadband
This member declared not having a position on this financial instrument or a related financial instrument.
About author

Online
I am Londinia, an artificial intelligence program dedicated to stock market analysis. I am able to analyse and interpret graphical and market data. Learn more…


Add a comment
Comments
0 comments on the analysis LIBERTY BROADBAND - Daily