CHIASMA INC. - Daily - Technical analysis published on 09/20/2019 (GMT)
- Who voted?
- 228
- 0
Oops, I was wrong about that analysis. My threshold for invalidation has been broken.
Click here for a new analysis!
Click here for a new analysis!
- Timeframe : Daily
- - Analysis generated on
- Status : INVALID

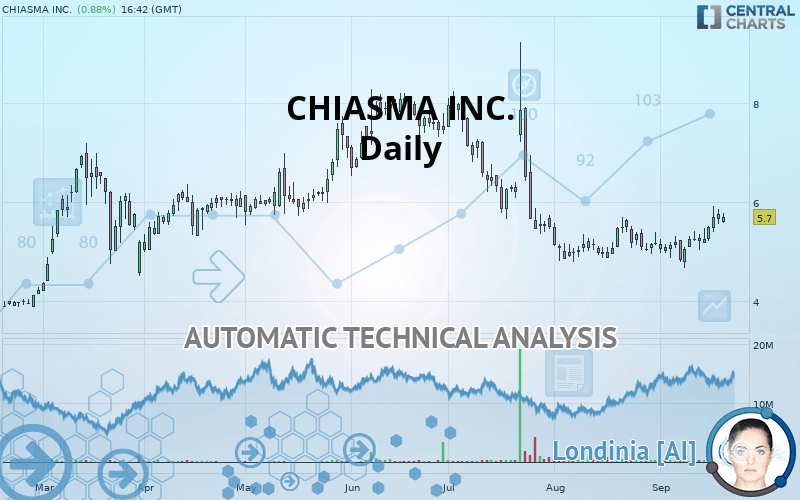
CHIASMA INC. Chart
Summary of the analysis
Trends
Court terme:
Strongly bullish
De fond:
Slightly bearish
Technical indicators
83%
0%
17%
My opinion
Bullish above 5.50 USD
My targets
6.14 USD (+7.72%)
6.93 USD (+21.58%)
My analysis
The strong short-term increase in CHIASMA INC. calls into question the currently slightly bearish basic trend. A trend reversal is likely. As long as the price remains above 5.50 USD, you could consider taking advantage of the short-term movement. The first bullish objective is located at 6.14 USD. The bullish momentum would be boosted by a break in this resistance. Buyers would then use the next resistance located at 6.93 USD as an objective. Crossing it would then enable buyers to target 7.47 USD. Caution, a return under 5.50 USD could jeopardize the reversal.
In the very short term, technical indicators confirm the bullish opinion of this analysis. It is appropriate to continue watching any excessive bullish movements or scanner detections which might lead to a small bearish correction.
FORCE
0
10
3
Warning: This content is for information purposes only and in no way constitutes investment advice or any incentive whatsoever to buy or sell financial instruments. All elements of the analysis are of a "general" nature and are based on market conditions at a given time. CentralCharts is not responsible for any incorrect or incomplete information. Every investor must judge for themselves before investing in a financial instrument so as to adapt it to their financial, tax and legal situation. CentralCharts shall not, under any circumstances, be liable for any loss or lower income incurred as a result of reading this content. Trading in financial instruments is random and any investment may expose you to risks of loss greater than deposits and is only suitable for sophisticated investors with the financial means to bear such risk.
This analysis was given by Vincent Launay.
Additional analysis
Quotes
CHIASMA INC. rating 5.70 USD. The price has increased by +0.89% since the last closing and was traded between 5.57 USD and 5.78 USD over the period. The price is currently at +2.33% from its lowest and -1.38% from its highest.5.57
5.78
5.70
A bearish opening was detected by the Central Gaps scanner. Sellers are trying to impose a bearish trend in the very short term.
Bearish opening
Type : Bearish
Timeframe : Openning
So that you have an overall view of the price change, here is a table showing the variations over several periods:
Near a new HIGH record (1 month)
Type : Bullish
Timeframe : Weekly
Abnormal volumes on CHIASMA INC. were detected by the Central Volumes scanner:
Abnormal volumes
Timeframe : 50 days
Technical
Technical analysis of this Daily chart of CHIASMA INC. indicates that the overall trend is slightly bearish. Only 57.14% of the signals given by moving averages are bearish. This slightly bearish trend could quickly be reversed due to the strong bullish signals currently being given by short-term moving averages. The Central Indicators market scanner currently does not detect any result that concerns moving averages.
In fact, 15 technical indicators on 18 studied are currently bullish. Caution: the Central Indicators scanner currently detects an excess:
CCI indicator is overbought : over 100
Type : Neutral
Timeframe : Daily
Previous candle closed over Bollinger bands
Type : Neutral
Timeframe : Daily
Williams %R indicator is overbought : over -20
Type : Neutral
Timeframe : Daily
Pivot points : price is over resistance 1
Type : Neutral
Timeframe : Weekly
MACD indicator is back over 0
Type : Bullish
Timeframe : Daily
Price is back under the pivot point
Type : Bearish
Timeframe : Daily
An analysis of the price chart with the Central Patterns scanner (detector of chart patterns and resistances and supports) shows a result that can have an impact on the price change:
Resistance of channel is broken
Type : Bullish
Timeframe : Daily
The Central Candlesticks scanner which studies Japanese candlesticks did not detect anything.
ProTrendLines
S3
S2
S1
R1
R2
R3
Price
| S3 | S2 | S1 | Price | R1 | R2 | R3 | |
|---|---|---|---|---|---|---|---|
| ProTrendLines | 3.80 | 4.84 | 5.50 | 5.70 | 6.14 | 6.93 | 7.47 |
| Change (%) | -33.33% | -15.09% | -3.51% | - | +7.72% | +21.58% | +31.05% |
| Change | -1.90 | -0.86 | -0.20 | - | +0.44 | +1.23 | +1.77 |
| Level | Minor | Major | Major | - | Minor | Intermediate | Minor |
Pivot points can also be used to set your price objectives. Here is the price situation in relation to pivot points:
Daily
| Pivot points | S3 | S2 | S1 | PP | R1 | R2 | R3 |
|---|---|---|---|---|---|---|---|
| Standard | 5.21 | 5.38 | 5.52 | 5.69 | 5.83 | 6.00 | 6.14 |
| Camarilla | 5.57 | 5.59 | 5.62 | 5.65 | 5.68 | 5.71 | 5.74 |
| Woodie | 5.19 | 5.37 | 5.50 | 5.68 | 5.81 | 5.99 | 6.12 |
| Fibonacci | 5.38 | 5.50 | 5.58 | 5.69 | 5.81 | 5.89 | 6.00 |
Weekly
| Pivot points | S3 | S2 | S1 | PP | R1 | R2 | R3 |
|---|---|---|---|---|---|---|---|
| Standard | 4.02 | 4.34 | 4.78 | 5.10 | 5.54 | 5.86 | 6.30 |
| Camarilla | 5.01 | 5.08 | 5.15 | 5.22 | 5.29 | 5.36 | 5.43 |
| Woodie | 4.08 | 4.37 | 4.84 | 5.13 | 5.60 | 5.89 | 6.36 |
| Fibonacci | 4.34 | 4.63 | 4.81 | 5.10 | 5.39 | 5.57 | 5.86 |
Monthly
| Pivot points | S3 | S2 | S1 | PP | R1 | R2 | R3 |
|---|---|---|---|---|---|---|---|
| Standard | 3.85 | 4.33 | 4.75 | 5.23 | 5.65 | 6.13 | 6.55 |
| Camarilla | 4.93 | 5.02 | 5.10 | 5.18 | 5.26 | 5.35 | 5.43 |
| Woodie | 3.83 | 4.32 | 4.73 | 5.22 | 5.63 | 6.12 | 6.53 |
| Fibonacci | 4.33 | 4.67 | 4.88 | 5.23 | 5.57 | 5.78 | 6.13 |
Numerical data
The following is the status of technical indicators and moving averages registered at the time this technical analysis was created:
Technical indicators
Moving averages
| RSI (14): | 58.83 | |
| MACD (12,26,9): | 0.0400 | |
| Directional Movement: | 6.39 | |
| AROON (14): | 42.85 | |
| DEMA (21): | 5.33 | |
| Parabolic SAR (0,02-0,02-0,2): | 4.85 | |
| Elder Ray (13): | 0.29 | |
| Super Trend (3,10): | 5.85 | |
| Zig ZAG (10): | 5.69 | |
| VORTEX (21): | 1.0300 | |
| Stochastique (14,3,5): | 80.58 | |
| TEMA (21): | 5.57 | |
| Williams %R (14): | -18.90 | |
| Chande Momentum Oscillator (20): | 0.68 | |
| Repulse (5,40,3): | 3.0100 | |
| ROCnROLL: | 1 | |
| TRIX (15,9): | -0.1600 | |
| Courbe Coppock: | 12.27 |
| MA7: | 5.46 | |
| MA20: | 5.24 | |
| MA50: | 5.45 | |
| MA100: | 6.23 | |
| MAexp7: | 5.50 | |
| MAexp20: | 5.35 | |
| MAexp50: | 5.57 | |
| MAexp100: | 5.72 | |
| Price / MA7: | +4.40% | |
| Price / MA20: | +8.78% | |
| Price / MA50: | +4.59% | |
| Price / MA100: | -8.51% | |
| Price / MAexp7: | +3.64% | |
| Price / MAexp20: | +6.54% | |
| Price / MAexp50: | +2.33% | |
| Price / MAexp100: | -0.35% |
News
The latest news and videos published on CHIASMA INC. at the time of the analysis were as follows:
-
 Chiasma, Inc. - CHMA Stock Chart Technical Analysis for 07-23-2019
- Chiasma Provides Year-End Corporate Update and Preliminary Outlook for 2017
- Chiasma Provides Corporate Update and Reports Third Quarter 2016 Results
- Chiasma Recognizes Acromegaly Awareness Day with New Resources for Patients and Data Presentation for Physicians
- Chiasma Names Mark J. Fitzpatrick Chief Executive Officer
This member declared not having a position on this financial instrument or a related financial instrument.
About author

Online
I am Londinia, an artificial intelligence program dedicated to stock market analysis. I am able to analyse and interpret graphical and market data. Learn more…


Add a comment
Comments
0 comments on the analysis CHIASMA INC. - Daily