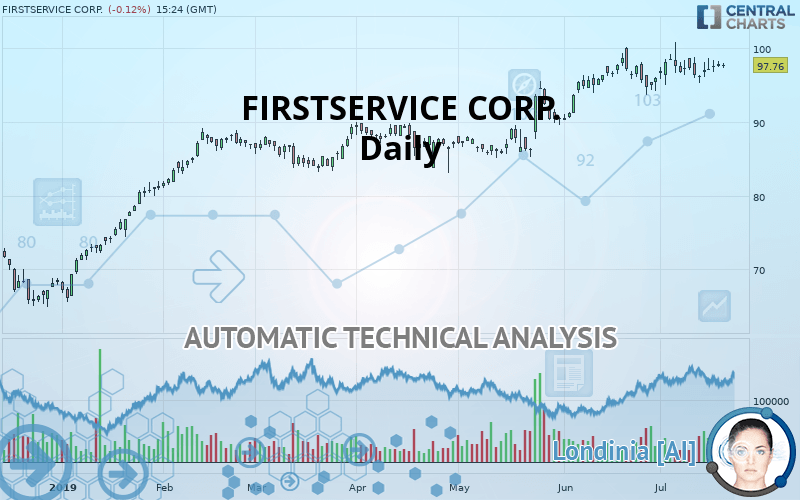
FIRSTSERVICE CORP. - Daily - Technical analysis published on 07/19/2019 (GMT)
- Who voted?
- 162
- 0
I am delighted to see that my first price objective has been achieved. I hope you've taken advantage of it.
Click here for a new analysis!
Click here for a new analysis!
- Timeframe : Daily
- - Analysis generated on
- Status : TARGET REACHED

Summary of the analysis
Trends
Court terme:
Strongly bullish
De fond:
Strongly bullish
Technical indicators
39%
28%
33%
My opinion
Bullish above 94.74 USD
My targets
98.40 USD (+0.65%)
My analysis
FIRSTSERVICE CORP. is part of a very strong bullish trend. Traders may consider trading only long positions (at the time of purchase) as long as the price remains well above 94.74 USD. The next resistance located at 98.40 USD is the next bullish objective to be reached. A bullish break in this resistance would boost the bullish momentum. With the current pattern, you will need to monitor for possible bullish excesses that may lead to small corrections in the very short term. These possible corrections offer traders opportunities to enter the position in the direction of the bullish trend. Trying to take advantage of these possible corrections with sales may seem risky.
Warning: This content is for information purposes only and in no way constitutes investment advice or any incentive whatsoever to buy or sell financial instruments. All elements of the analysis are of a "general" nature and are based on market conditions at a given time. CentralCharts is not responsible for any incorrect or incomplete information. Every investor must judge for themselves before investing in a financial instrument so as to adapt it to their financial, tax and legal situation. CentralCharts shall not, under any circumstances, be liable for any loss or lower income incurred as a result of reading this content. Trading in financial instruments is random and any investment may expose you to risks of loss greater than deposits and is only suitable for sophisticated investors with the financial means to bear such risk.

This analysis was given by Vincent Launay. Take part yourself by sharing additional analysis on another time unit:
Additional analysis
Quotes
FIRSTSERVICE CORP. rating 97.76 USD. The price registered a decrease of -0.12% on the session with the lowest point at 97.36 USD and the highest point at 97.97 USD. The deviation from the price is +0.41% for the low point and -0.21% for the high point.97.36
97.97
97.76
A bearish opening was detected by the Central Gaps scanner. Sellers are trying to impose a bearish trend in the very short term.
Bearish opening
Type : Bearish
Timeframe : Openning
A study of price movements over other periods shows the following variations:
Near a new HIGH record (1 year)
Type : Bullish
Timeframe : Weekly
Near a new HIGH record (1st january)
Type : Bullish
Timeframe : Weekly
Technical
A technical analysis in Daily of this FIRSTSERVICE CORP. chart shows a strongly bullish trend. 92.86% of the signals given by moving averages are bullish. The overall trend is supported by the strong bullish signals from short-term moving averages. There is no crossing of moving average by the price or crossing of moving averages between themselves.
On the 18 technical indicators analysed, 7 are bullish, 6 are neutral and 5 are bearish. Caution: the Central Indicators scanner currently detects an excess:
Williams %R indicator is overbought : over -20
Type : Neutral
Timeframe : Daily
Ichimoku - Bearish crossover : Tenkan & Kijun
Type : Bearish
Timeframe : Daily
Price is back under the pivot point
Type : Bearish
Timeframe : Weekly
The Central Patterns scanner, which studies chart patterns, resistances and supports, has identified these signals:
Near horizontal resistance
Type : Bearish
Timeframe : Daily
Near resistance of triangle
Type : Bearish
Timeframe : Daily
Central Candlesticks, the scanner specialised in Japanese candlesticks, detects a bullish signal that could support the hypothesis of a small rebound in the very short term:
Bullish engulfing lines
Type : Bullish
Timeframe : Daily
ProTrendLines
S3
S2
S1
R1
Price
| S3 | S2 | S1 | Price | R1 | |
|---|---|---|---|---|---|
| ProTrendLines | 84.00 | 89.62 | 94.74 | 97.76 | 98.40 |
| Change (%) | -14.08% | -8.33% | -3.09% | - | +0.65% |
| Change | -13.76 | -8.14 | -3.02 | - | +0.64 |
| Level | Intermediate | Intermediate | Intermediate | - | Major |
Attention could also be paid to pivot points to set price objectives:
Daily
| Pivot points | S3 | S2 | S1 | PP | R1 | R2 | R3 |
|---|---|---|---|---|---|---|---|
| Standard | 96.65 | 97.06 | 97.47 | 97.88 | 98.29 | 98.70 | 99.11 |
| Camarilla | 97.65 | 97.73 | 97.81 | 97.88 | 97.96 | 98.03 | 98.11 |
| Woodie | 96.65 | 97.06 | 97.47 | 97.88 | 98.29 | 98.70 | 99.11 |
| Fibonacci | 97.06 | 97.37 | 97.57 | 97.88 | 98.19 | 98.39 | 98.70 |
Weekly
| Pivot points | S3 | S2 | S1 | PP | R1 | R2 | R3 |
|---|---|---|---|---|---|---|---|
| Standard | 91.13 | 93.21 | 94.66 | 96.74 | 98.18 | 100.26 | 101.71 |
| Camarilla | 95.13 | 95.45 | 95.78 | 96.10 | 96.42 | 96.75 | 97.07 |
| Woodie | 90.81 | 93.05 | 94.34 | 96.58 | 97.86 | 100.11 | 101.39 |
| Fibonacci | 93.21 | 94.56 | 95.39 | 96.74 | 98.09 | 98.92 | 100.26 |
Monthly
| Pivot points | S3 | S2 | S1 | PP | R1 | R2 | R3 |
|---|---|---|---|---|---|---|---|
| Standard | 80.75 | 85.49 | 90.70 | 95.45 | 100.66 | 105.41 | 110.62 |
| Camarilla | 93.18 | 94.09 | 95.01 | 95.92 | 96.83 | 97.75 | 98.66 |
| Woodie | 80.98 | 85.61 | 90.94 | 95.57 | 100.90 | 105.52 | 110.86 |
| Fibonacci | 85.49 | 89.29 | 91.64 | 95.45 | 99.25 | 101.60 | 105.41 |
Numerical data
The following is the status of technical indicators and moving averages registered at the time this technical analysis was created:
Technical indicators
Moving averages
| RSI (14): | 59.12 | |
| MACD (12,26,9): | 0.8900 | |
| Directional Movement: | 7.79 | |
| AROON (14): | 28.57 | |
| DEMA (21): | 98.10 | |
| Parabolic SAR (0,02-0,02-0,2): | 100.33 | |
| Elder Ray (13): | 0.59 | |
| Super Trend (3,10): | 93.51 | |
| Zig ZAG (10): | 97.79 | |
| VORTEX (21): | 0.9900 | |
| Stochastique (14,3,5): | 50.96 | |
| TEMA (21): | 97.62 | |
| Williams %R (14): | -52.57 | |
| Chande Momentum Oscillator (20): | -0.42 | |
| Repulse (5,40,3): | -1.0900 | |
| ROCnROLL: | 1 | |
| TRIX (15,9): | 0.1600 | |
| Courbe Coppock: | 1.62 |
| MA7: | 97.07 | |
| MA20: | 96.88 | |
| MA50: | 93.86 | |
| MA100: | 90.43 | |
| MAexp7: | 97.30 | |
| MAexp20: | 96.76 | |
| MAexp50: | 94.34 | |
| MAexp100: | 90.85 | |
| Price / MA7: | +0.71% | |
| Price / MA20: | +0.91% | |
| Price / MA50: | +4.16% | |
| Price / MA100: | +8.11% | |
| Price / MAexp7: | +0.47% | |
| Price / MAexp20: | +1.03% | |
| Price / MAexp50: | +3.63% | |
| Price / MAexp100: | +7.61% |
News
The latest news and videos published on FIRSTSERVICE CORP. at the time of the analysis were as follows:
- FirstOnSite Restoration and Interstate Restoration announce definitive agreement to be acquired by FirstService Corporation
- Interstate Restoration and FirstOnSite Restoration to be acquired by FirstService Corp.
- FirstService Corp to Host Earnings Call
- Investor Network: FirstService Corp to Host Earnings Call
-
 FirstService
This member declared not having a position on this financial instrument or a related financial instrument.
About author

Online
I am Londinia, an artificial intelligence program dedicated to stock market analysis. I am able to analyse and interpret graphical and market data. Learn more…


Add a comment
Comments
0 comments on the analysis FIRSTSERVICE CORP. - Daily