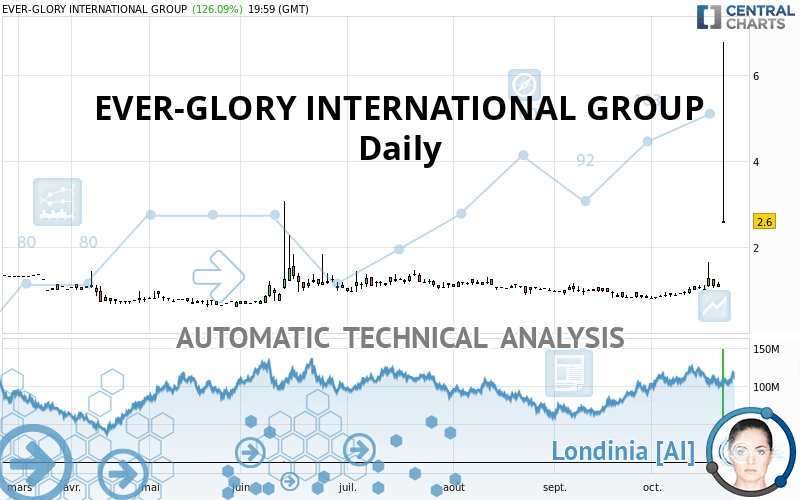
EVER-GLORY INTERNATIONAL GROUP - Daily - Technical analysis published on 10/23/2020 (GMT)
- 194
- 0
Click here for a new analysis!
- Timeframe : Daily
- - Analysis generated on
- Status : TARGET REACHED

Summary of the analysis
Additional analysis
Quotes
EVER-GLORY INTERNATIONAL GROUP rating 2.60 USD. On the day, this instrument gained +126.09% and was traded between 2.55 USD and 6.76 USD over the period. The price is currently at +1.96% from its lowest and -61.54% from its highest.The Central Gaps scanner detects a bullish gap which is a sign that buyers have taken the lead in the very short term.
Opening Gap UP
Type : Bullish
Timeframe : Openning
Here is a more detailed summary of the historical variations registered by EVER-GLORY INTERNATIONAL GROUP:
New HIGH record (5 years)
Type : Bullish
Timeframe : Weekly
New HIGH record (1 year)
Type : Bullish
Timeframe : Weekly
New HIGH record (1st january)
Type : Bullish
Timeframe : Weekly
New HIGH record (1 month)
Type : Bullish
Timeframe : Weekly
The Central Volumes scanner notes the presence of abnormal volumes:
Abnormal volumes
Timeframe : 5 days
Abnormal volumes
Timeframe : 20 days
Abnormal volumes
Timeframe : 50 days
Technical
A technical analysis in Daily of this EVER-GLORY INTERNATIONAL GROUP chart shows a strongly bullish trend. 82.14% of the signals given by moving averages are bullish. The overall trend is supported by the strong bullish signals from short-term moving averages. The Central Indicators scanner does not detect any result on moving averages that would impact this trend.
An assessment of technical indicators shows a strong bullish signal.
But beware of excesses. The Central Indicators scanner currently detects this:
CCI indicator is overbought : over 100
Type : Neutral
Timeframe : Daily
Williams %R indicator is overbought : over -20
Type : Neutral
Timeframe : Daily
Pivot points : price is over resistance 3
Type : Neutral
Timeframe : Daily
Pivot points : price is over resistance 3
Type : Neutral
Timeframe : Weekly
Central Patterns, the scanner specializing in chart patterns, did not identify any signals.
The Central Candlesticks scanner, specialised in Japanese candlesticks, did not identify any signals.
| S3 | S2 | S1 | Price | R1 | R2 | R3 | |
|---|---|---|---|---|---|---|---|
| ProTrendLines | 1.51 | 1.76 | 2.15 | 2.60 | 2.62 | 3.40 | 4.09 |
| Change (%) | -41.92% | -32.31% | -17.31% | - | +0.77% | +30.77% | +57.31% |
| Change | -1.09 | -0.84 | -0.45 | - | +0.02 | +0.80 | +1.49 |
| Level | Intermediate | Minor | Minor | - | Intermediate | Minor | Major |
To determine price objectives, it is also possible to use the pivot points. Here is the price position in relation to pivot points:
| Pivot points | S3 | S2 | S1 | PP | R1 | R2 | R3 |
|---|---|---|---|---|---|---|---|
| Standard | 0.98 | 1.02 | 1.09 | 1.13 | 1.20 | 1.24 | 1.31 |
| Camarilla | 1.12 | 1.13 | 1.14 | 1.15 | 1.16 | 1.17 | 1.18 |
| Woodie | 0.99 | 1.03 | 1.10 | 1.14 | 1.21 | 1.25 | 1.32 |
| Fibonacci | 1.02 | 1.07 | 1.09 | 1.13 | 1.18 | 1.20 | 1.24 |
| Pivot points | S3 | S2 | S1 | PP | R1 | R2 | R3 |
|---|---|---|---|---|---|---|---|
| Standard | 0.66 | 0.77 | 0.90 | 1.01 | 1.14 | 1.25 | 1.38 |
| Camarilla | 0.97 | 0.99 | 1.01 | 1.03 | 1.05 | 1.07 | 1.10 |
| Woodie | 0.67 | 0.78 | 0.91 | 1.02 | 1.15 | 1.25 | 1.39 |
| Fibonacci | 0.77 | 0.86 | 0.92 | 1.01 | 1.10 | 1.16 | 1.25 |
| Pivot points | S3 | S2 | S1 | PP | R1 | R2 | R3 |
|---|---|---|---|---|---|---|---|
| Standard | 0.39 | 0.61 | 0.73 | 0.95 | 1.07 | 1.29 | 1.41 |
| Camarilla | 0.76 | 0.80 | 0.83 | 0.86 | 0.89 | 0.92 | 0.95 |
| Woodie | 0.35 | 0.58 | 0.69 | 0.92 | 1.03 | 1.26 | 1.37 |
| Fibonacci | 0.61 | 0.74 | 0.82 | 0.95 | 1.08 | 1.16 | 1.29 |
Numerical data
The following is the status of technical indicators and moving averages registered at the time this technical analysis was created:
| RSI (14): | 86.08 | |
| MACD (12,26,9): | 0.1700 | |
| Directional Movement: | 82.25 | |
| AROON (14): | 100.00 | |
| DEMA (21): | 1.32 | |
| Parabolic SAR (0,02-0,02-0,2): | 1.05 | |
| Elder Ray (13): | 3.40 | |
| Super Trend (3,10): | 2.57 | |
| Zig ZAG (10): | 2.60 | |
| VORTEX (21): | 1.0200 | |
| Stochastique (14,3,5): | 35.34 | |
| TEMA (21): | 1.50 | |
| Williams %R (14): | -70.27 | |
| Chande Momentum Oscillator (20): | 1.71 | |
| Repulse (5,40,3): | -108.3600 | |
| ROCnROLL: | 1 | |
| TRIX (15,9): | 0.5500 | |
| Courbe Coppock: | 122.50 |
| MA7: | 1.32 | |
| MA20: | 1.04 | |
| MA50: | 1.02 | |
| MA100: | 1.07 | |
| MAexp7: | 1.47 | |
| MAexp20: | 1.16 | |
| MAexp50: | 1.07 | |
| MAexp100: | 1.10 | |
| Price / MA7: | +96.97% | |
| Price / MA20: | +150.00% | |
| Price / MA50: | +154.90% | |
| Price / MA100: | +142.99% | |
| Price / MAexp7: | +76.87% | |
| Price / MAexp20: | +124.14% | |
| Price / MAexp50: | +142.99% | |
| Price / MAexp100: | +136.36% |
News
The last news published on EVER-GLORY INTERNATIONAL GROUP at the time of the generation of this analysis was as follows:
- Ever-Glory Reports Third Quarter 2019 Financial Results
- Ever-Glory To Report Third Quarter 2019 Earnings on November 13, 2019
- Ever-Glory Reports Second Quarter 2019 Financial Results
- Ever-Glory To Report Second Quarter 2019 Earnings on August 14, 2019
- Ever-Glory Reports First Quarter 2019 Financial Results
About author

Online


Add a comment
Comments
0 comments on the analysis EVER-GLORY INTERNATIONAL GROUP - Daily