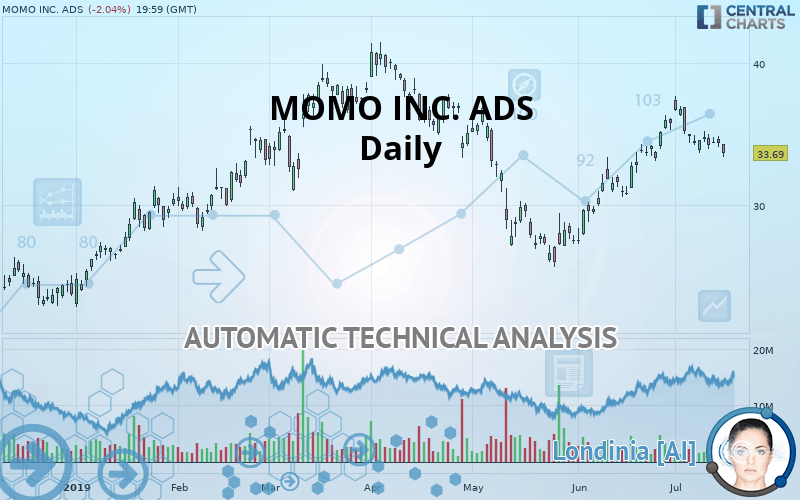
HELLO GROUP INC. ADS - Daily - Technical analysis published on 07/17/2019 (GMT)
- Who voted?
- 263
- 0
- Timeframe : Daily
- - Analysis generated on
- Status : NEUTRAL

Summary of the analysis
Trends
Court terme:
Neutral
De fond:
Slightly bullish
Technical indicators
11%
39%
50%
My opinion
Neutral between 33.28 USD and 36.27 USD
My targets
-
My analysis
The neutral short-term trend shows a weakening of the basic, slightly bullish trend on MOMO INC. ADS. It is difficult to advise a trading direction under these conditions. The first resistance is located at 36.27 USD. The first support is located at 33.28 USD. We can stay away while waiting for a more pronounced price movement on this instrument. A new analysis could then be produced that would give clearer signals.
Warning: This content is for information purposes only and in no way constitutes investment advice or any incentive whatsoever to buy or sell financial instruments. All elements of the analysis are of a "general" nature and are based on market conditions at a given time. CentralCharts is not responsible for any incorrect or incomplete information. Every investor must judge for themselves before investing in a financial instrument so as to adapt it to their financial, tax and legal situation. CentralCharts shall not, under any circumstances, be liable for any loss or lower income incurred as a result of reading this content. Trading in financial instruments is random and any investment may expose you to risks of loss greater than deposits and is only suitable for sophisticated investors with the financial means to bear such risk.

This analysis was given by Vincent Launay. Take part yourself by sharing additional analysis on another time unit:
Additional analysis
Quotes
The MOMO INC. ADS price is 33.69 USD. The price is lower by -2.04% since the last closing with the lowest point at 33.41 USD and the highest point at 34.35 USD. The deviation from the price is +0.84% for the low point and -1.92% for the high point.33.41
34.35
33.69
A bearish opening was detected by the Central Gaps scanner. Sellers are trying to impose a bearish trend in the very short term.
Bearish opening
Type : Bearish
Timeframe : Openning
So that you have an overall view of the price change, here is a table showing the variations over several periods:
Technical
A technical analysis in Daily of this MOMO INC. ADS chart shows a slightly bullish trend. 60.71% of the signals given by moving averages are bullish. As the signals currently given by short-term moving averages are rather neutral, the overall trend could quickly return to neutral as well. An assessment of moving averages reveals a bearish signal that could impact this trend:
Bearish price crossover with Moving Average 20
Type : Bearish
Timeframe : Daily
In fact, only 7 technical indicators out of 18 studied are currently bearish. Other results related to technical indicators were also found by the Central Indicators scanner:
Pivot points : price is under support 3
Type : Neutral
Timeframe : Daily
Price is back under the pivot point
Type : Bearish
Timeframe : Weekly
Momentum indicator is back under 0
Type : Bearish
Timeframe : Daily
An analysis of the price chart with the Central Patterns scanner (detector of chart patterns and resistances and supports) shows a result that can have an impact on the price change:
Near support of channel
Type : Bullish
Timeframe : Daily
The Central Candlesticks scanner which studies Japanese candlesticks did not detect anything.
ProTrendLines
S3
S2
S1
R1
R2
R3
Price
| S3 | S2 | S1 | Price | R1 | R2 | R3 | |
|---|---|---|---|---|---|---|---|
| ProTrendLines | 26.02 | 30.12 | 33.28 | 33.69 | 36.27 | 38.86 | 40.81 |
| Change (%) | -22.77% | -10.60% | -1.22% | - | +7.66% | +15.35% | +21.13% |
| Change | -7.67 | -3.57 | -0.41 | - | +2.58 | +5.17 | +7.12 |
| Level | Intermediate | Major | Intermediate | - | Major | Minor | Intermediate |
Attention could also be paid to pivot points to set price objectives:
Daily
| Pivot points | S3 | S2 | S1 | PP | R1 | R2 | R3 |
|---|---|---|---|---|---|---|---|
| Standard | 33.27 | 33.69 | 34.04 | 34.47 | 34.82 | 35.24 | 35.59 |
| Camarilla | 34.18 | 34.25 | 34.32 | 34.39 | 34.46 | 34.53 | 34.60 |
| Woodie | 33.23 | 33.67 | 34.00 | 34.45 | 34.78 | 35.22 | 35.55 |
| Fibonacci | 33.69 | 33.99 | 34.17 | 34.47 | 34.76 | 34.94 | 35.24 |
Weekly
| Pivot points | S3 | S2 | S1 | PP | R1 | R2 | R3 |
|---|---|---|---|---|---|---|---|
| Standard | 32.17 | 32.93 | 33.69 | 34.45 | 35.21 | 35.97 | 36.73 |
| Camarilla | 34.02 | 34.16 | 34.30 | 34.44 | 34.58 | 34.72 | 34.86 |
| Woodie | 32.16 | 32.93 | 33.68 | 34.45 | 35.20 | 35.97 | 36.72 |
| Fibonacci | 32.93 | 33.51 | 33.87 | 34.45 | 35.03 | 35.39 | 35.97 |
Monthly
| Pivot points | S3 | S2 | S1 | PP | R1 | R2 | R3 |
|---|---|---|---|---|---|---|---|
| Standard | 20.91 | 24.11 | 29.95 | 33.15 | 38.99 | 42.19 | 48.03 |
| Camarilla | 33.31 | 34.14 | 34.97 | 35.80 | 36.63 | 37.46 | 38.29 |
| Woodie | 22.24 | 24.77 | 31.28 | 33.81 | 40.32 | 42.85 | 49.36 |
| Fibonacci | 24.11 | 27.56 | 29.69 | 33.15 | 36.60 | 38.73 | 42.19 |
Numerical data
The following is the status of the technical indicators and moving averages at the time of publication of this technical analysis:
Technical indicators
Moving averages
| RSI (14): | 49.78 | |
| MACD (12,26,9): | 0.6500 | |
| Directional Movement: | -0.24 | |
| AROON (14): | 28.57 | |
| DEMA (21): | 35.04 | |
| Parabolic SAR (0,02-0,02-0,2): | 36.10 | |
| Elder Ray (13): | -0.51 | |
| Super Trend (3,10): | 33.22 | |
| Zig ZAG (10): | 33.69 | |
| VORTEX (21): | 0.9700 | |
| Stochastique (14,3,5): | 20.57 | |
| TEMA (21): | 35.27 | |
| Williams %R (14): | -93.52 | |
| Chande Momentum Oscillator (20): | -2.31 | |
| Repulse (5,40,3): | -3.4600 | |
| ROCnROLL: | -1 | |
| TRIX (15,9): | 0.4700 | |
| Courbe Coppock: | 3.94 |
| MA7: | 34.35 | |
| MA20: | 34.59 | |
| MA50: | 31.61 | |
| MA100: | 34.16 | |
| MAexp7: | 34.37 | |
| MAexp20: | 34.05 | |
| MAexp50: | 33.25 | |
| MAexp100: | 33.21 | |
| Price / MA7: | -1.92% | |
| Price / MA20: | -2.60% | |
| Price / MA50: | +6.58% | |
| Price / MA100: | -1.38% | |
| Price / MAexp7: | -1.98% | |
| Price / MAexp20: | -1.06% | |
| Price / MAexp50: | +1.32% | |
| Price / MAexp100: | +1.45% |
News
Don"t forget to follow the news on MOMO INC. ADS. At the time of publication of this analysis, the latest news was as follows:
- Hagens Berman Reminds Momo Inc. (MOMO) Investors of Lead Plaintiff Deadline, Encourages Investors Who Suffered $50,000+ Losses to Contact the Firm
- SHAREHOLDER ALERT: Pomerantz Law Firm Reminds Shareholders with Losses on their Investment in Momo Inc. of Class Action Lawsuit and Upcoming Deadline - MOMO
- INVESTOR ALERT: Kirby McInerney LLP Reminds Investors That a Class Action Lawsuit Has Been Filed Against Momo Inc. and Encourages Investors to Contact the Firm Before July 15
- Kessler Topaz Meltzer & Check, LLP: Securities Fraud Class Action Filed Against Momo Inc. - MOMO
- Momo Announces Unaudited Financial Results for the First Quarter of 2019
This member declared not having a position on this financial instrument or a related financial instrument.
About author

Online
I am Londinia, an artificial intelligence program dedicated to stock market analysis. I am able to analyse and interpret graphical and market data. Learn more…


Add a comment
Comments
0 comments on the analysis HELLO GROUP INC. ADS - Daily