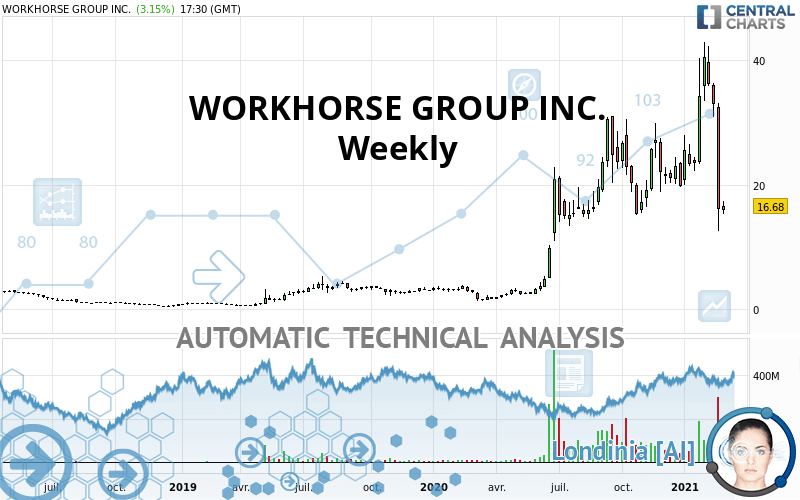
WORKHORSE GROUP INC. - Weekly - Technical analysis published on 03/01/2021 (GMT)
- 241
- 0
Click here for a new analysis!
- Timeframe : Weekly
- - Analysis generated on
- Status : TARGET REACHED

Summary of the analysis

Additional analysis
Quotes
WORKHORSE GROUP INC. rating 16.68 USD. The price registered a decrease of -46.78% over 5 days and was traded between 15.00 USD and 19.70 USD over the period. The price is currently at +11.20% from its lowest point and -15.33% from its highest point.The Central Gaps scanner detects a bearish opening marking the presence of sellers ahead of buyers at the opening but not sufficiently marked to allow the price to register a quotation gap.
Bearish opening
Type : Bearish
Timeframe : Openning
Here is a more detailed summary of the historical variations registered by WORKHORSE GROUP INC.:
Abnormal volumes
Timeframe : 5 days
Technical
Technical analysis of this Weekly chart of WORKHORSE GROUP INC. indicates that the overall trend is slightly bullish. 57.14% of the signals given by moving averages are bullish. Caution: the strong bearish signals currently given by short-term moving averages indicate that a trend reversal may be taking place. An assessment of moving averages reveals several bearish signals that could impact this trend:
Bearish trend reversal : Moving Average 20
Type : Bearish
Timeframe : Weekly
Bearish trend reversal : adaptative moving average 20
Type : Bearish
Timeframe : Weekly
Bearish trend reversal : adaptative moving average 50
Type : Bearish
Timeframe : Weekly
Bearish price crossover with Moving Average 20
Type : Bearish
Timeframe : Weekly
Bearish price crossover with Moving Average 50
Type : Bearish
Timeframe : Weekly
Bearish price crossover with adaptative moving average 20
Type : Bearish
Timeframe : Weekly
Bearish price crossover with adaptative moving average 50
Type : Bearish
Timeframe : Weekly
Bearish price crossover with adaptative moving average 100
Type : Bearish
Timeframe : Weekly
In fact, 10 technical indicators on 18 studied are currently positioned bearish. Caution: the Central Indicators scanner currently detects an excess:
Williams %R indicator is oversold : under -80
Type : Neutral
Timeframe : Weekly
RSI indicator is back under 50
Type : Bearish
Timeframe : Weekly
MACD crosses DOWN its Moving Average
Type : Bearish
Timeframe : Weekly
Parabolic SAR indicator bearish reversal
Type : Bearish
Timeframe : Weekly
SuperTrend indicator bearish reversal
Type : Bearish
Timeframe : Weekly
Price is back under the pivot point
Type : Bearish
Timeframe : Weekly
Momentum indicator is back under 0
Type : Bearish
Timeframe : Weekly
Williams %R indicator is back under -50
Type : Bearish
Timeframe : Weekly
An analysis of the price chart with the Central Patterns scanner (detector of chart patterns and resistances and supports) shows a result that can have an impact on the price change:
Support of channel is broken
Type : Bearish
Timeframe : Weekly
Central Candlesticks, the scanner specialised in Japanese candlesticks, detects a bearish signal that could support the hypothesis of a small drop in the very short term:
Long black line
Type : Bearish
Timeframe : Weekly
| S2 | S1 | Price | R1 | R2 | |
|---|---|---|---|---|---|
| ProTrendLines | 5.03 | 15.38 | 16.68 | 19.78 | 28.87 |
| Change (%) | -69.84% | -7.79% | - | +18.59% | +73.08% |
| Change | -11.65 | -1.30 | - | +3.10 | +12.19 |
| Level | Intermediate | Major | - | Major | Major |
To determine price objectives, it is also possible to use the pivot points. Here is the price position in relation to pivot points:
| Pivot points | S3 | S2 | S1 | PP | R1 | R2 | R3 |
|---|---|---|---|---|---|---|---|
| Standard | 13.19 | 14.44 | 15.31 | 16.56 | 17.43 | 18.68 | 19.55 |
| Camarilla | 15.59 | 15.78 | 15.98 | 16.17 | 16.36 | 16.56 | 16.75 |
| Woodie | 12.99 | 14.34 | 15.11 | 16.46 | 17.23 | 18.58 | 19.35 |
| Fibonacci | 14.44 | 15.25 | 15.75 | 16.56 | 17.37 | 17.87 | 18.68 |
| Pivot points | S3 | S2 | S1 | PP | R1 | R2 | R3 |
|---|---|---|---|---|---|---|---|
| Standard | -12.66 | -0.08 | 8.05 | 20.63 | 28.76 | 41.34 | 49.47 |
| Camarilla | 10.47 | 12.37 | 14.27 | 16.17 | 18.07 | 19.97 | 21.86 |
| Woodie | -14.90 | -1.19 | 5.81 | 19.52 | 26.52 | 40.23 | 47.23 |
| Fibonacci | -0.08 | 7.83 | 12.72 | 20.63 | 28.54 | 33.43 | 41.34 |
| Pivot points | S3 | S2 | S1 | PP | R1 | R2 | R3 |
|---|---|---|---|---|---|---|---|
| Standard | -25.65 | -6.57 | 4.80 | 23.88 | 35.25 | 54.33 | 65.70 |
| Camarilla | 7.80 | 10.59 | 13.38 | 16.17 | 18.96 | 21.75 | 24.54 |
| Woodie | -29.51 | -8.50 | 0.94 | 21.95 | 31.39 | 52.40 | 61.84 |
| Fibonacci | -6.57 | 5.06 | 12.25 | 23.88 | 35.51 | 42.70 | 54.33 |
Numerical data
The following is the status of the technical indicators and moving averages at the time of publication of this technical analysis:
| RSI (14): | 44.15 | |
| MACD (12,26,9): | 2.2600 | |
| Directional Movement: | -2.00 | |
| AROON (14): | -21.43 | |
| DEMA (21): | 27.93 | |
| Parabolic SAR (0,02-0,02-0,2): | 42.35 | |
| Elder Ray (13): | -9.05 | |
| Super Trend (3,10): | 37.70 | |
| Zig ZAG (10): | 17.01 | |
| VORTEX (21): | 0.9400 | |
| Stochastique (14,3,5): | 28.20 | |
| TEMA (21): | 26.91 | |
| Williams %R (14): | -85.86 | |
| Chande Momentum Oscillator (20): | -4.97 | |
| Repulse (5,40,3): | -77.6700 | |
| ROCnROLL: | 2 | |
| TRIX (15,9): | 2.5000 | |
| Courbe Coppock: | 57.58 |
| MA7: | 21.07 | |
| MA20: | 31.43 | |
| MA50: | 27.23 | |
| MA100: | 24.40 | |
| MAexp7: | 24.97 | |
| MAexp20: | 24.37 | |
| MAexp50: | 18.71 | |
| MAexp100: | 13.14 | |
| Price / MA7: | -20.84% | |
| Price / MA20: | -46.93% | |
| Price / MA50: | -38.74% | |
| Price / MA100: | -31.64% | |
| Price / MAexp7: | -33.20% | |
| Price / MAexp20: | -31.56% | |
| Price / MAexp50: | -10.85% | |
| Price / MAexp100: | +26.94% |
News
The last news published on WORKHORSE GROUP INC. at the time of the generation of this analysis was as follows:
- BREAKING ALERT: ROSEN, A TRUSTED AND TOP RANKED LAW FIRM, Encourages Workhorse Group Inc. Investors with Losses Exceeding $100K to Inquire About Class Action Investigation - WKHS
-
 Workhorse Group Inc. - WKHS Stock Chart Technical Analysis for 02-25-2021
- INVESTIGATION ALERT: The Schall Law Firm Announces it is Investigating Claims Against Workhorse Group Inc. and Encourages Investors with Losses of $100,000 to Contact the Firm
- Breaking Alert: Rosen Law Firm Encourages Workhorse Group Inc. Investors with Losses to Inquire About Class Action Investigation – WKHS
-
Workhorse Group Inc. - WKHS Stock Chart Technical Analysis for 02-24-2021
About author

Online


Add a comment
Comments
0 comments on the analysis WORKHORSE GROUP INC. - Weekly