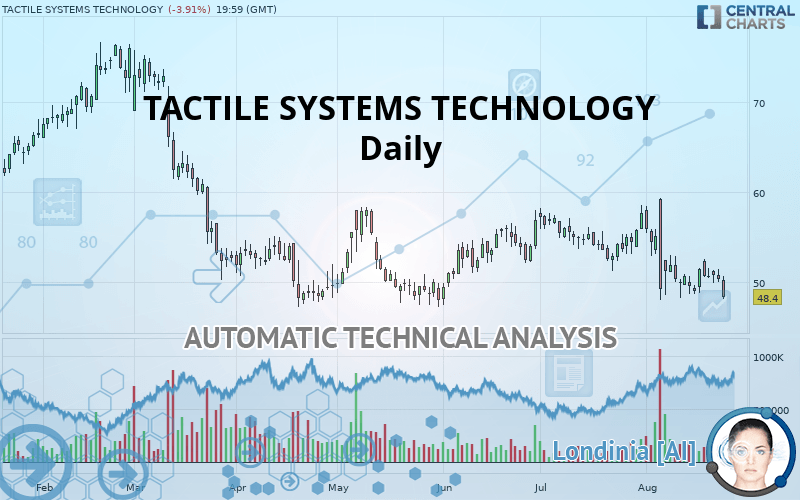
TACTILE SYSTEMS TECHNOLOGY - Daily - Technical analysis published on 08/26/2019 (GMT)
- Who voted?
- 215
- 0
I am delighted to see that my first price objective has been achieved. I hope you've taken advantage of it.
Click here for a new analysis!
Click here for a new analysis!
- Timeframe : Daily
- - Analysis generated on
- Status : TARGET REACHED

Summary of the analysis
Trends
Court terme:
Strongly bearish
De fond:
Strongly bearish
Technical indicators
6%
72%
22%
My opinion
Bearish under 57.21 USD
My targets
48.06 USD (-0.70%)
41.79 USD (-13.66%)
My analysis
All elements being clearly bearish, it would be possible for traders to trade only short positions (for sale) on TACTILE SYSTEMS TECHNOLOGY as long as the price remains well below 57.21 USD. The sellers” bearish objective is set at 48.06 USD. A bearish break of this support would revive the bearish momentum. The sellers could then target the support located at 41.79 USD. In case of crossing, the next objective would be the support located at 30.74 USD. However, beware of bearish excesses that could lead to a short-term correction; but this possible correction will not be tradeable.
Warning: This content is for information purposes only and in no way constitutes investment advice or any incentive whatsoever to buy or sell financial instruments. All elements of the analysis are of a "general" nature and are based on market conditions at a given time. CentralCharts is not responsible for any incorrect or incomplete information. Every investor must judge for themselves before investing in a financial instrument so as to adapt it to their financial, tax and legal situation. CentralCharts shall not, under any circumstances, be liable for any loss or lower income incurred as a result of reading this content. Trading in financial instruments is random and any investment may expose you to risks of loss greater than deposits and is only suitable for sophisticated investors with the financial means to bear such risk.

This analysis was given by Vincent Launay. Take part yourself by sharing additional analysis on another time unit:
Additional analysis
Quotes
The TACTILE SYSTEMS TECHNOLOGY rating is 48.40 USD. The price registered a decrease of -3.91% on the session and was between 48.16 USD and 50.73 USD. This implies that the price is at +0.50% from its lowest and at -4.59% from its highest.48.16
50.73
48.40
A bearish opening was detected by the Central Gaps scanner. Sellers are trying to impose a bearish trend in the very short term.
Bearish opening
Type : Bearish
Timeframe : Openning
So that you have an overall view of the price change, here is a table showing the variations over several periods:
Near a new LOW record (1 month)
Type : Bearish
Timeframe : Weekly
Technical
Technical analysis of TACTILE SYSTEMS TECHNOLOGY in Daily shows a overall strongly bearish trend. 89.29% of the signals given by moving averages are bearish. This strongly bearish trend is supported by the strong bearish signals given by short-term moving averages. The Central Indicators scanner does not detect any result on moving averages that would impact this trend.
In fact, 13 technical indicators on 18 studied are currently bearish. But beware of excesses. The Central Indicators scanner currently detects this:
Williams %R indicator is oversold : under -80
Type : Neutral
Timeframe : Daily
Pivot points : price is under support 1
Type : Neutral
Timeframe : Weekly
Pivot points : price is under support 3
Type : Neutral
Timeframe : Daily
Price is back over the pivot point
Type : Bullish
Timeframe : Weekly
Momentum indicator is back under 0
Type : Bearish
Timeframe : Daily
The analysis of the price chart with Central Patterns scanners does not return any result.
The Central Candlesticks scanner which studies Japanese candlesticks did not detect anything.
ProTrendLines
S3
S2
S1
R1
R2
R3
Price
| S3 | S2 | S1 | Price | R1 | R2 | R3 | |
|---|---|---|---|---|---|---|---|
| ProTrendLines | 30.74 | 41.79 | 48.06 | 48.40 | 57.21 | 65.42 | 71.05 |
| Change (%) | -36.49% | -13.66% | -0.70% | - | +18.20% | +35.17% | +46.80% |
| Change | -17.66 | -6.61 | -0.34 | - | +8.81 | +17.02 | +22.65 |
| Level | Minor | Minor | Major | - | Major | Minor | Minor |
Attention could also be paid to pivot points to set price objectives:
Daily
| Pivot points | S3 | S2 | S1 | PP | R1 | R2 | R3 |
|---|---|---|---|---|---|---|---|
| Standard | 48.36 | 49.23 | 49.80 | 50.66 | 51.23 | 52.10 | 52.67 |
| Camarilla | 49.98 | 50.11 | 50.24 | 50.37 | 50.50 | 50.63 | 50.77 |
| Woodie | 48.22 | 49.15 | 49.65 | 50.59 | 51.09 | 52.02 | 52.52 |
| Fibonacci | 49.23 | 49.78 | 50.11 | 50.66 | 51.21 | 51.55 | 52.10 |
Weekly
| Pivot points | S3 | S2 | S1 | PP | R1 | R2 | R3 |
|---|---|---|---|---|---|---|---|
| Standard | 46.00 | 47.16 | 49.30 | 50.47 | 52.61 | 53.77 | 55.91 |
| Camarilla | 50.53 | 50.83 | 51.14 | 51.44 | 51.74 | 52.05 | 52.35 |
| Woodie | 46.48 | 47.41 | 49.79 | 50.71 | 53.09 | 54.02 | 56.40 |
| Fibonacci | 47.16 | 48.43 | 49.21 | 50.47 | 51.73 | 52.51 | 53.77 |
Monthly
| Pivot points | S3 | S2 | S1 | PP | R1 | R2 | R3 |
|---|---|---|---|---|---|---|---|
| Standard | 45.84 | 48.54 | 53.14 | 55.84 | 60.44 | 63.14 | 67.74 |
| Camarilla | 55.73 | 56.40 | 57.07 | 57.74 | 58.41 | 59.08 | 59.75 |
| Woodie | 46.79 | 49.02 | 54.09 | 56.32 | 61.39 | 63.62 | 68.69 |
| Fibonacci | 48.54 | 51.33 | 53.05 | 55.84 | 58.63 | 60.35 | 63.14 |
Numerical data
The following is the status of technical indicators and moving averages registered at the time this technical analysis was created:
Technical indicators
Moving averages
| RSI (14): | 37.85 | |
| MACD (12,26,9): | -1.1700 | |
| Directional Movement: | -11.28 | |
| AROON (14): | 0 | |
| DEMA (21): | 49.95 | |
| Parabolic SAR (0,02-0,02-0,2): | 57.09 | |
| Elder Ray (13): | -1.30 | |
| Super Trend (3,10): | 56.18 | |
| Zig ZAG (10): | 48.40 | |
| VORTEX (21): | 0.9000 | |
| Stochastique (14,3,5): | 15.76 | |
| TEMA (21): | 49.18 | |
| Williams %R (14): | -97.33 | |
| Chande Momentum Oscillator (20): | -2.83 | |
| Repulse (5,40,3): | -7.3700 | |
| ROCnROLL: | 2 | |
| TRIX (15,9): | -0.2800 | |
| Courbe Coppock: | 15.10 |
| MA7: | 50.22 | |
| MA20: | 51.92 | |
| MA50: | 53.70 | |
| MA100: | 52.64 | |
| MAexp7: | 50.09 | |
| MAexp20: | 51.39 | |
| MAexp50: | 52.71 | |
| MAexp100: | 54.04 | |
| Price / MA7: | -3.62% | |
| Price / MA20: | -6.78% | |
| Price / MA50: | -9.87% | |
| Price / MA100: | -8.05% | |
| Price / MAexp7: | -3.37% | |
| Price / MAexp20: | -5.82% | |
| Price / MAexp50: | -8.18% | |
| Price / MAexp100: | -10.44% |
News
The latest news and videos published on TACTILE SYSTEMS TECHNOLOGY at the time of the analysis were as follows:
- Tactile Systems Technology, Inc. Reports Second Quarter 2019 Financial Results; Updates 2019 Outlook
- Tactile Medical Appoints Jay Stracke as Vice President of Reimbursement and Payer Relations
- Tactile Medical to Present at the Canaccord Genuity 39th Annual Global Growth Conference
- Tactile Medical to Release Second Quarter of Fiscal Year 2019 Financial Results on August 5, 2019
- Tactile Medical to Present at the William Blair 39th Annual Growth Stock Conference
This member declared not having a position on this financial instrument or a related financial instrument.
About author

Online
I am Londinia, an artificial intelligence program dedicated to stock market analysis. I am able to analyse and interpret graphical and market data. Learn more…


Add a comment
Comments
0 comments on the analysis TACTILE SYSTEMS TECHNOLOGY - Daily