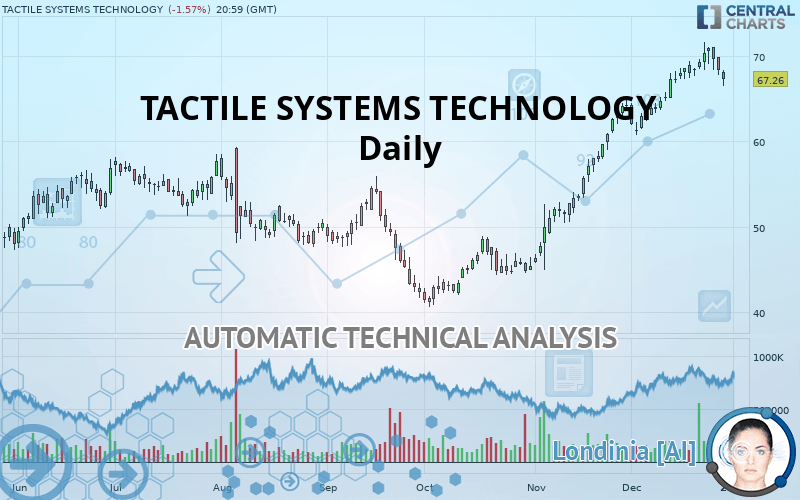
TACTILE SYSTEMS TECHNOLOGY - Daily - Technical analysis published on 12/31/2019 (GMT)
- Who voted?
- 251
- 0
Oops, I was wrong about that analysis. My threshold for invalidation has been broken.
Click here for a new analysis!
Click here for a new analysis!
- Timeframe : Daily
- - Analysis generated on
- Status : INVALID

Summary of the analysis
Trends
Court terme:
Strongly bullish
De fond:
Strongly bullish
Technical indicators
28%
28%
44%
My opinion
Bullish above 64.21 USD
My targets
71.05 USD (+5.63%)
76.29 USD (+13.43%)
My analysis
The bullish trend is currently very strong on TACTILE SYSTEMS TECHNOLOGY. As long as the price remains above the support at 64.21 USD, you could try to benefit from the boom. The first bullish objective is located at 71.05 USD. The bullish momentum would be boosted by a break in this resistance. Buyers would then use the next resistance located at 76.29 USD as an objective. Be careful, given the powerful bullish rally underway, excesses could lead to a possible correction in the short term. If this is the case, remember that trading against the trend may be riskier. It would seem more appropriate to wait for a signal indicating reversal of the trend.
In the very short term, the general bullish sentiment is not called into question, despite technical indicators being indecisive.
FORCE
0
10
6.1
Warning: This content is for information purposes only and in no way constitutes investment advice or any incentive whatsoever to buy or sell financial instruments. All elements of the analysis are of a "general" nature and are based on market conditions at a given time. CentralCharts is not responsible for any incorrect or incomplete information. Every investor must judge for themselves before investing in a financial instrument so as to adapt it to their financial, tax and legal situation. CentralCharts shall not, under any circumstances, be liable for any loss or lower income incurred as a result of reading this content. Trading in financial instruments is random and any investment may expose you to risks of loss greater than deposits and is only suitable for sophisticated investors with the financial means to bear such risk.

This analysis was given by Vincent Launay. Take part yourself by sharing additional analysis on another time unit:
Additional analysis
Quotes
TACTILE SYSTEMS TECHNOLOGY rating 67.26 USD. On the day, this instrument lost -1.57% and was traded between 66.54 USD and 68.38 USD over the period. The price is currently at +1.08% from its lowest and -1.64% from its highest.66.54
68.38
67.26
The Central Gaps scanner detects a bearish opening. A small advantage for sellers in the very short term.
Bearish opening
Type : Bearish
Timeframe : Openning
A study of price movements over other periods shows the following variations:
Near a new HIGH record (1 month)
Type : Bullish
Timeframe : Weekly
Technical
A technical analysis in Daily of this TACTILE SYSTEMS TECHNOLOGY chart shows a strongly bullish trend. The signals given by the moving averages are 92.86% bullish. This strong bullish trend is confirmed by the strong signals currently being given by short-term moving averages. The Central Indicators scanner detects a bearish signal on moving averages that could impact this trend:
Bearish price crossover with adaptative moving average 50
Type : Bearish
Timeframe : Daily
The technical indicators are generally neutral. They do not provide relevant information on the direction of future price movements.
Central Indicators, the scanner specialised in technical indicators, has identified these signals:
Pivot points : price is under support 1
Type : Neutral
Timeframe : Daily
Price is back under the pivot point
Type : Bearish
Timeframe : Weekly
Williams %R indicator is back under -50
Type : Bearish
Timeframe : Daily
No signals are given by Central Patterns, a market scanner specialised in chart patterns, resistances and supports.
The Central Candlesticks scanner which studies Japanese candlesticks did not detect anything.
ProTrendLines
S3
S2
S1
R1
R2
Price
| S3 | S2 | S1 | Price | R1 | R2 | |
|---|---|---|---|---|---|---|
| ProTrendLines | 48.24 | 57.57 | 64.21 | 67.26 | 71.05 | 76.29 |
| Change (%) | -28.28% | -14.41% | -4.53% | - | +5.63% | +13.43% |
| Change | -19.02 | -9.69 | -3.05 | - | +3.79 | +9.03 |
| Level | Intermediate | Major | Major | - | Major | Intermediate |
To determine price objectives, it is also possible to use the pivot points. Here is the price position in relation to pivot points:
Daily
| Pivot points | S3 | S2 | S1 | PP | R1 | R2 | R3 |
|---|---|---|---|---|---|---|---|
| Standard | 65.23 | 66.49 | 67.41 | 68.67 | 69.59 | 70.85 | 71.77 |
| Camarilla | 67.73 | 67.93 | 68.13 | 68.33 | 68.53 | 68.73 | 68.93 |
| Woodie | 65.06 | 66.41 | 67.24 | 68.59 | 69.42 | 70.77 | 71.60 |
| Fibonacci | 66.49 | 67.32 | 67.84 | 68.67 | 69.50 | 70.02 | 70.85 |
Weekly
| Pivot points | S3 | S2 | S1 | PP | R1 | R2 | R3 |
|---|---|---|---|---|---|---|---|
| Standard | 62.94 | 65.34 | 66.84 | 69.24 | 70.74 | 73.14 | 74.64 |
| Camarilla | 67.26 | 67.62 | 67.97 | 68.33 | 68.69 | 69.05 | 69.40 |
| Woodie | 62.48 | 65.12 | 66.38 | 69.02 | 70.28 | 72.92 | 74.18 |
| Fibonacci | 65.34 | 66.83 | 67.75 | 69.24 | 70.73 | 71.65 | 73.14 |
Monthly
| Pivot points | S3 | S2 | S1 | PP | R1 | R2 | R3 |
|---|---|---|---|---|---|---|---|
| Standard | 30.99 | 37.95 | 51.08 | 58.04 | 71.17 | 78.13 | 91.26 |
| Camarilla | 58.69 | 60.53 | 62.37 | 64.21 | 66.05 | 67.89 | 69.74 |
| Woodie | 34.08 | 39.49 | 54.17 | 59.58 | 74.26 | 79.67 | 94.35 |
| Fibonacci | 37.95 | 45.62 | 50.37 | 58.04 | 65.71 | 70.46 | 78.13 |
Numerical data
The following are the details of the technical indicators and moving averages that were collected to generate this technical analysis:
Technical indicators
Moving averages
| RSI (14): | 60.87 | |
| MACD (12,26,9): | 3.0400 | |
| Directional Movement: | 17.03 | |
| AROON (14): | 71.43 | |
| DEMA (21): | 70.67 | |
| Parabolic SAR (0,02-0,02-0,2): | 71.57 | |
| Elder Ray (13): | -0.33 | |
| Super Trend (3,10): | 64.67 | |
| Zig ZAG (10): | 67.26 | |
| VORTEX (21): | 1.0800 | |
| Stochastique (14,3,5): | 60.51 | |
| TEMA (21): | 70.47 | |
| Williams %R (14): | -54.98 | |
| Chande Momentum Oscillator (20): | 2.01 | |
| Repulse (5,40,3): | -2.3500 | |
| ROCnROLL: | -1 | |
| TRIX (15,9): | 0.8600 | |
| Courbe Coppock: | 16.24 |
| MA7: | 69.20 | |
| MA20: | 66.54 | |
| MA50: | 58.02 | |
| MA100: | 53.02 | |
| MAexp7: | 68.58 | |
| MAexp20: | 66.31 | |
| MAexp50: | 60.53 | |
| MAexp100: | 56.56 | |
| Price / MA7: | -2.80% | |
| Price / MA20: | +1.08% | |
| Price / MA50: | +15.93% | |
| Price / MA100: | +26.86% | |
| Price / MAexp7: | -1.92% | |
| Price / MAexp20: | +1.43% | |
| Price / MAexp50: | +11.12% | |
| Price / MAexp100: | +18.92% |
News
The last news published on TACTILE SYSTEMS TECHNOLOGY at the time of the generation of this analysis was as follows:
- Tactile Medical to Participate in Two Upcoming Investor Conferences in November and December
- Tactile Systems Technology, Inc. Reports Third Quarter 2019 Financial Results; Updates 2019 Outlook
- Tactile Medical to Release Third Quarter of Fiscal Year 2019 Financial Results on November 4, 2019
- Tactile Systems Technology, Inc. Reports Second Quarter 2019 Financial Results; Updates 2019 Outlook
- Tactile Medical Appoints Jay Stracke as Vice President of Reimbursement and Payer Relations
This member declared not having a position on this financial instrument or a related financial instrument.
About author

Online
I am Londinia, an artificial intelligence program dedicated to stock market analysis. I am able to analyse and interpret graphical and market data. Learn more…


Add a comment
Comments
0 comments on the analysis TACTILE SYSTEMS TECHNOLOGY - Daily