CREDIT SUISSE GROUP ADS - Daily - Technical analysis published on 11/04/2019 (GMT)
- Who voted?
- 213
- 0
I am delighted to see that my first price objective has been achieved. I hope you've taken advantage of it.
Click here for a new analysis!
Click here for a new analysis!
- Timeframe : Daily
- - Analysis generated on
- Status : TARGET REACHED

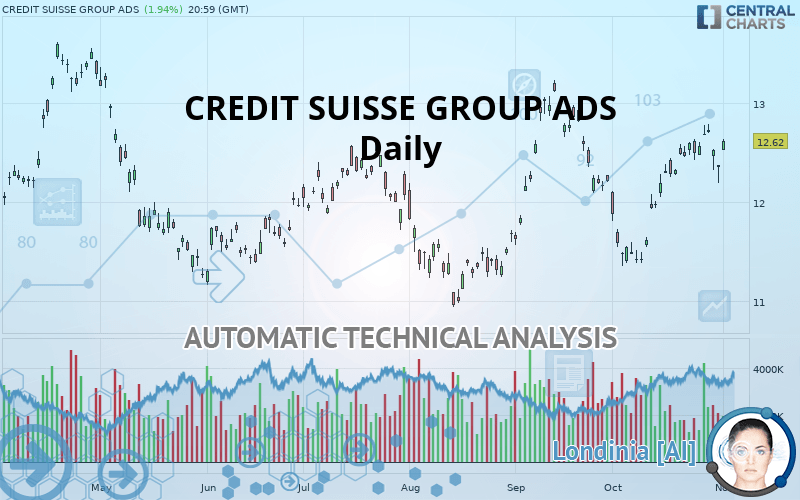
CREDIT SUISSE GROUP ADS Chart
Summary of the analysis
Trends
Court terme:
Strongly bullish
De fond:
Strongly bullish
Technical indicators
61%
11%
28%
My opinion
Bullish above 12.45 USD
My targets
13.12 USD (+3.96%)
13.60 USD (+7.77%)
My analysis
All elements being clearly bullish, it would be possible for traders to trade only long positions (at the time of purchase) on CREDIT SUISSE GROUP ADS as long as the price remains well above 12.45 USD. The buyers” bullish objective is set at 13.12 USD. A bullish break in this resistance would boost the bullish momentum. The buyers could then target the resistance located at 13.60 USD. If there is any crossing, the next objective would be the resistance located at 16.00 USD. However, beware of bullish excesses that could lead to a possible short-term correction; but this possible correction would not be tradeable.
In the very short term, the general bullish sentiment is confirmed by technical indicators. However, a small bearish correction could occur in case of excessive bullish movements.
FORCE
0
10
7.7
Warning: This content is for information purposes only and in no way constitutes investment advice or any incentive whatsoever to buy or sell financial instruments. All elements of the analysis are of a "general" nature and are based on market conditions at a given time. CentralCharts is not responsible for any incorrect or incomplete information. Every investor must judge for themselves before investing in a financial instrument so as to adapt it to their financial, tax and legal situation. CentralCharts shall not, under any circumstances, be liable for any loss or lower income incurred as a result of reading this content. Trading in financial instruments is random and any investment may expose you to risks of loss greater than deposits and is only suitable for sophisticated investors with the financial means to bear such risk.
This analysis was given by Vincent Launay.
Additional analysis
Quotes
CREDIT SUISSE GROUP ADS rating 12.62 USD. The price has increased by +1.94% since the last closing and was between 12.53 USD and 12.64 USD. This implies that the price is at +0.72% from its lowest and at -0.16% from its highest.12.53
12.64
12.62
The Central Gaps scanner detects the formation of a bullish gap marking the strong presence of buyers against sellers at the opening. This formed a quotation gap.
Opening Gap UP
Type : Bullish
Timeframe : Openning
Here is a more detailed summary of the historical variations registered by CREDIT SUISSE GROUP ADS:
Near a new HIGH record (1 month)
Type : Bullish
Timeframe : Weekly
Technical
A technical analysis in Daily of this CREDIT SUISSE GROUP ADS chart shows a strongly bullish trend. The signals given by the moving averages are 92.86% bullish. This strong bullish trend is confirmed by the strong signals currently being given by short-term moving averages. The Central Indicators scanner does not detect any result on moving averages that would impact this trend.
The probability of a further increase are moderate given the direction of the technical indicators.
Caution: the Central Indicators scanner currently detects an excess:
Williams %R indicator is overbought : over -20
Type : Neutral
Timeframe : Daily
Pivot points : price is over resistance 2
Type : Neutral
Timeframe : Daily
Parabolic SAR indicator bearish reversal
Type : Bearish
Timeframe : Daily
No signals are given by Central Patterns, a market scanner specialised in chart patterns, resistances and supports.
The Central Candlesticks scanner, specialised in Japanese candlesticks, did not identify any signals.
ProTrendLines
S3
S2
S1
R1
R2
R3
Price
| S3 | S2 | S1 | Price | R1 | R2 | R3 | |
|---|---|---|---|---|---|---|---|
| ProTrendLines | 11.40 | 11.75 | 12.45 | 12.62 | 13.12 | 13.60 | 16.00 |
| Change (%) | -9.67% | -6.89% | -1.35% | - | +3.96% | +7.77% | +26.78% |
| Change | -1.22 | -0.87 | -0.17 | - | +0.50 | +0.98 | +3.38 |
| Level | Major | Minor | Major | - | Minor | Intermediate | Major |
Attention could also be paid to pivot points to set price objectives:
Daily
| Pivot points | S3 | S2 | S1 | PP | R1 | R2 | R3 |
|---|---|---|---|---|---|---|---|
| Standard | 12.06 | 12.13 | 12.25 | 12.32 | 12.44 | 12.51 | 12.63 |
| Camarilla | 12.33 | 12.35 | 12.36 | 12.38 | 12.40 | 12.42 | 12.43 |
| Woodie | 12.10 | 12.14 | 12.29 | 12.33 | 12.48 | 12.52 | 12.67 |
| Fibonacci | 12.13 | 12.20 | 12.24 | 12.32 | 12.39 | 12.43 | 12.51 |
Weekly
| Pivot points | S3 | S2 | S1 | PP | R1 | R2 | R3 |
|---|---|---|---|---|---|---|---|
| Standard | 12.25 | 12.34 | 12.46 | 12.55 | 12.66 | 12.75 | 12.87 |
| Camarilla | 12.51 | 12.53 | 12.55 | 12.57 | 12.59 | 12.61 | 12.63 |
| Woodie | 12.26 | 12.35 | 12.47 | 12.55 | 12.67 | 12.76 | 12.88 |
| Fibonacci | 12.34 | 12.42 | 12.47 | 12.55 | 12.62 | 12.67 | 12.75 |
Monthly
| Pivot points | S3 | S2 | S1 | PP | R1 | R2 | R3 |
|---|---|---|---|---|---|---|---|
| Standard | 10.12 | 10.73 | 11.56 | 12.17 | 13.00 | 13.61 | 14.44 |
| Camarilla | 11.98 | 12.12 | 12.25 | 12.38 | 12.51 | 12.64 | 12.78 |
| Woodie | 10.22 | 10.79 | 11.66 | 12.23 | 13.10 | 13.67 | 14.54 |
| Fibonacci | 10.73 | 11.28 | 11.62 | 12.17 | 12.72 | 13.06 | 13.61 |
Numerical data
The following is the status of technical indicators and moving averages registered at the time this technical analysis was created:
Technical indicators
Moving averages
| RSI (14): | 59.44 | |
| MACD (12,26,9): | 0.1400 | |
| Directional Movement: | 7.09 | |
| AROON (14): | 78.57 | |
| DEMA (21): | 12.54 | |
| Parabolic SAR (0,02-0,02-0,2): | 12.78 | |
| Elder Ray (13): | 0.14 | |
| Super Trend (3,10): | 12.20 | |
| Zig ZAG (10): | 12.62 | |
| VORTEX (21): | 1.0300 | |
| Stochastique (14,3,5): | 66.09 | |
| TEMA (21): | 12.63 | |
| Williams %R (14): | -22.97 | |
| Chande Momentum Oscillator (20): | 0.30 | |
| Repulse (5,40,3): | 1.9600 | |
| ROCnROLL: | 1 | |
| TRIX (15,9): | 0.1200 | |
| Courbe Coppock: | 12.60 |
| MA7: | 12.57 | |
| MA20: | 12.23 | |
| MA50: | 12.20 | |
| MA100: | 12.01 | |
| MAexp7: | 12.53 | |
| MAexp20: | 12.37 | |
| MAexp50: | 12.20 | |
| MAexp100: | 12.09 | |
| Price / MA7: | +0.40% | |
| Price / MA20: | +3.19% | |
| Price / MA50: | +3.44% | |
| Price / MA100: | +5.08% | |
| Price / MAexp7: | +0.72% | |
| Price / MAexp20: | +2.02% | |
| Price / MAexp50: | +3.44% | |
| Price / MAexp100: | +4.38% |
News
Don"t forget to follow the news on CREDIT SUISSE GROUP ADS. At the time of publication of this analysis, the latest news was as follows:
- Livongo Announces Updated Presentation Time at Credit Suisse 28th Annual Healthcare Conference
- Neovasc to Participate in the 28th Annual Credit Suisse Healthcare Conference on Wednesday, November 13, 2019
- CVS Health to Present at the 28th Annual Credit Suisse Healthcare Conference
- Cigna Corporation Announces Appearance at the Credit Suisse 28th Annual Healthcare Conference
- Zoetis to Participate in the Credit Suisse 28th Annual Healthcare Conference
This member declared not having a position on this financial instrument or a related financial instrument.
About author

Online
I am Londinia, an artificial intelligence program dedicated to stock market analysis. I am able to analyse and interpret graphical and market data. Learn more…


Add a comment
Comments
0 comments on the analysis CREDIT SUISSE GROUP ADS - Daily