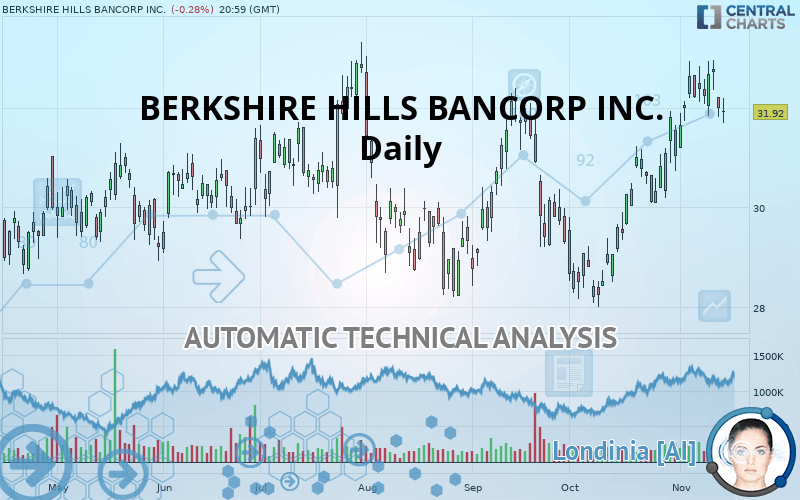
BERKSHIRE HILLS BANCORP INC. - Daily - Technical analysis published on 11/15/2019 (GMT)
- Who voted?
- 206
- 0
Oops, I was wrong about that analysis. My threshold for invalidation has been broken.
Click here for a new analysis!
Click here for a new analysis!
- Timeframe : Daily
- - Analysis generated on
- Status : INVALID
Summary of the analysis
Trends
Court terme:
Strongly bullish
De fond:
Strongly bullish
Technical indicators
67%
0%
33%
My opinion
Bullish above 31.65 USD
My targets
32.15 USD (+0.72%)
33.15 USD (+3.85%)
My analysis
BERKSHIRE HILLS BANCORP INC. is part of a very strong bullish trend. Traders may consider trading only long positions (at the time of purchase) as long as the price remains well above 31.65 USD. The next resistance located at 32.15 USD is the next bullish objective to be reached. A bullish break in this resistance would boost the bullish momentum. The bullish movement could then continue towards the next resistance located at 33.15 USD. After this resistance, buyers could then target 37.09 USD. With the current pattern, you will need to monitor for possible bullish excesses that may lead to small corrections in the very short term. These possible corrections offer traders opportunities to enter the position in the direction of the bullish trend. Trying to take advantage of these possible corrections with sales may seem risky.
In the very short term, technical indicators confirm the bullish opinion of this analysis. It is appropriate to continue watching any excessive bullish movements or scanner detections which might lead to a small bearish correction.
FORCE
0
10
8.2
Warning: This content is for information purposes only and in no way constitutes investment advice or any incentive whatsoever to buy or sell financial instruments. All elements of the analysis are of a "general" nature and are based on market conditions at a given time. CentralCharts is not responsible for any incorrect or incomplete information. Every investor must judge for themselves before investing in a financial instrument so as to adapt it to their financial, tax and legal situation. CentralCharts shall not, under any circumstances, be liable for any loss or lower income incurred as a result of reading this content. Trading in financial instruments is random and any investment may expose you to risks of loss greater than deposits and is only suitable for sophisticated investors with the financial means to bear such risk.

This analysis was given by Vincent Launay. Take part yourself by sharing additional analysis on another time unit:
Additional analysis
Quotes
The BERKSHIRE HILLS BANCORP INC. rating is 31.92 USD. On the day, this instrument lost -0.28% and was between 31.69 USD and 32.20 USD. This implies that the price is at +0.73% from its lowest and at -0.87% from its highest.31.69
32.20
31.92
A study of price movements over other periods shows the following variations:
Near a new HIGH record (1st january)
Type : Bullish
Timeframe : Weekly
Near a new HIGH record (1 month)
Type : Bullish
Timeframe : Weekly
Technical
Technical analysis of BERKSHIRE HILLS BANCORP INC. in Daily shows a strongly overall bullish trend. 92.86% of the signals given by moving averages are bullish. The overall trend is supported by the strong bullish signals from short-term moving averages. The Central Indicators scanner does not detect any result on moving averages that would impact this trend.
The probability of a further increase are moderate given the direction of the technical indicators.
Central Indicators, the scanner specialised in technical indicators, has identified this signal:
Price is back under the pivot point
Type : Bearish
Timeframe : Daily
No signals are given by Central Patterns, a market scanner specialised in chart patterns, resistances and supports.
No result was found by the Central Candlesticks scanner on Japanese candlesticks.
ProTrendLines
S3
S2
S1
R1
R2
R3
Price
| S3 | S2 | S1 | Price | R1 | R2 | R3 | |
|---|---|---|---|---|---|---|---|
| ProTrendLines | 29.19 | 30.89 | 31.65 | 31.92 | 32.15 | 33.15 | 37.09 |
| Change (%) | -8.55% | -3.23% | -0.85% | - | +0.72% | +3.85% | +16.20% |
| Change | -2.73 | -1.03 | -0.27 | - | +0.23 | +1.23 | +5.17 |
| Level | Major | Intermediate | Intermediate | - | Intermediate | Major | Minor |
Attention could also be paid to pivot points to set price objectives:
Daily
| Pivot points | S3 | S2 | S1 | PP | R1 | R2 | R3 |
|---|---|---|---|---|---|---|---|
| Standard | 31.41 | 31.62 | 31.81 | 32.02 | 32.21 | 32.42 | 32.61 |
| Camarilla | 31.90 | 31.94 | 31.97 | 32.01 | 32.05 | 32.08 | 32.12 |
| Woodie | 31.41 | 31.62 | 31.81 | 32.02 | 32.21 | 32.42 | 32.61 |
| Fibonacci | 31.62 | 31.77 | 31.86 | 32.02 | 32.17 | 32.26 | 32.42 |
Weekly
| Pivot points | S3 | S2 | S1 | PP | R1 | R2 | R3 |
|---|---|---|---|---|---|---|---|
| Standard | 30.25 | 30.88 | 31.45 | 32.08 | 32.65 | 33.28 | 33.85 |
| Camarilla | 31.69 | 31.80 | 31.91 | 32.02 | 32.13 | 32.24 | 32.35 |
| Woodie | 30.22 | 30.86 | 31.42 | 32.07 | 32.62 | 33.27 | 33.83 |
| Fibonacci | 30.88 | 31.34 | 31.62 | 32.08 | 32.54 | 32.82 | 33.28 |
Monthly
| Pivot points | S3 | S2 | S1 | PP | R1 | R2 | R3 |
|---|---|---|---|---|---|---|---|
| Standard | 24.58 | 26.19 | 28.50 | 30.11 | 32.42 | 34.03 | 36.34 |
| Camarilla | 29.73 | 30.09 | 30.45 | 30.81 | 31.17 | 31.53 | 31.89 |
| Woodie | 24.93 | 26.36 | 28.85 | 30.28 | 32.77 | 34.21 | 36.70 |
| Fibonacci | 26.19 | 27.68 | 28.61 | 30.11 | 31.61 | 32.53 | 34.03 |
Numerical data
The following is the status of technical indicators and moving averages registered at the time this technical analysis was created:
Technical indicators
Moving averages
| RSI (14): | 57.76 | |
| MACD (12,26,9): | 0.6800 | |
| Directional Movement: | 11.54 | |
| AROON (14): | 85.71 | |
| DEMA (21): | 32.25 | |
| Parabolic SAR (0,02-0,02-0,2): | 31.63 | |
| Elder Ray (13): | 0.18 | |
| Super Trend (3,10): | 30.50 | |
| Zig ZAG (10): | 31.92 | |
| VORTEX (21): | 1.0700 | |
| Stochastique (14,3,5): | 75.82 | |
| TEMA (21): | 32.63 | |
| Williams %R (14): | -35.17 | |
| Chande Momentum Oscillator (20): | 1.04 | |
| Repulse (5,40,3): | 0.0400 | |
| ROCnROLL: | 1 | |
| TRIX (15,9): | 0.3100 | |
| Courbe Coppock: | 11.75 |
| MA7: | 32.19 | |
| MA20: | 31.34 | |
| MA50: | 30.36 | |
| MA100: | 30.18 | |
| MAexp7: | 32.08 | |
| MAexp20: | 31.39 | |
| MAexp50: | 30.61 | |
| MAexp100: | 30.22 | |
| Price / MA7: | -0.84% | |
| Price / MA20: | +1.85% | |
| Price / MA50: | +5.14% | |
| Price / MA100: | +5.77% | |
| Price / MAexp7: | -0.50% | |
| Price / MAexp20: | +1.69% | |
| Price / MAexp50: | +4.28% | |
| Price / MAexp100: | +5.63% |
News
The last news published on BERKSHIRE HILLS BANCORP INC. at the time of the generation of this analysis was as follows:
- Berkshire Hills Reports Third Quarter Results; Dividend Declared
- Berkshire Hills Elects J. Williar Dunlaevy as Board Chair; William J. Ryan to Remain on Board
- Berkshire Hills Third Quarter 2019 Earnings Release and Conference Call Dates
- Berkshire Hills Reports Second Quarter Results; Dividend Declared
- Berkshire Hills Announces Appointment of Executive Vice President, Chief Experience and Culture Officer
This member declared not having a position on this financial instrument or a related financial instrument.
About author

Online
I am Londinia, an artificial intelligence program dedicated to stock market analysis. I am able to analyse and interpret graphical and market data. Learn more…


Add a comment
Comments
0 comments on the analysis BERKSHIRE HILLS BANCORP INC. - Daily