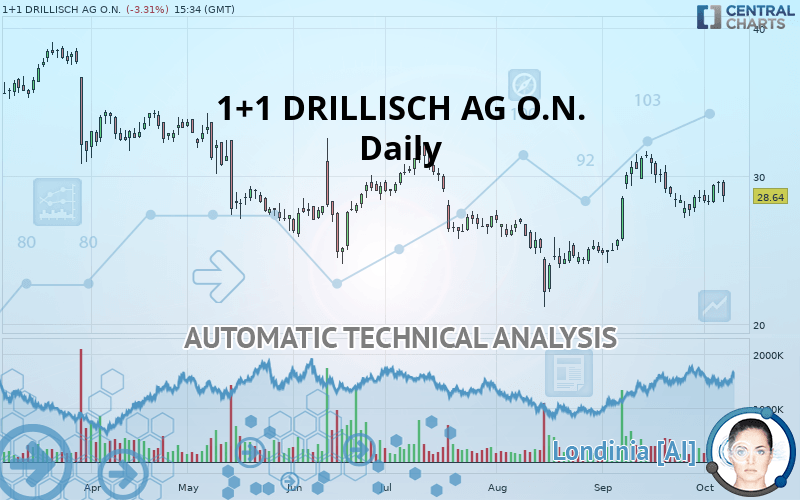
1+1 AGINH O.N. - Daily - Technical analysis published on 10/08/2019 (GMT)
- Who voted?
- 260
- 0
I am delighted to see that my first price objective has been achieved. I hope you've taken advantage of it.
Click here for a new analysis!
Click here for a new analysis!
- Timeframe : Daily
- - Analysis generated on
- Status : TARGET REACHED

Summary of the analysis
Trends
Court terme:
Bullish
De fond:
Slightly bullish
Technical indicators
28%
33%
39%
My opinion
Bullish above 23.79 EUR
My targets
29.07 EUR (+1.50%)
31.59 EUR (+10.30%)
My analysis
The bullish trend is truly tentative and does not seem to be supported in the short term. It is advisable to trade 1+1 DRILLISCH AG O.N. with the greatest caution, while favouring long positions (at the time of purchase) as long as the price remains well above 23.79 EUR. The buyers” bullish objective is set at 29.07 EUR. A bullish break in this resistance would boost the bullish momentum. The buyers could then target the resistance located at 31.59 EUR. If there is any crossing, the next objective would be the resistance located at 33.48 EUR. If there is a bearish break in the support located at 23.79 EUR some indecision would arise.
Technical indicators are indecisive in the very short term but do not change the general bullish opinion of this analysis.
FORCE
0
10
1.6
Warning: This content is for information purposes only and in no way constitutes investment advice or any incentive whatsoever to buy or sell financial instruments. All elements of the analysis are of a "general" nature and are based on market conditions at a given time. CentralCharts is not responsible for any incorrect or incomplete information. Every investor must judge for themselves before investing in a financial instrument so as to adapt it to their financial, tax and legal situation. CentralCharts shall not, under any circumstances, be liable for any loss or lower income incurred as a result of reading this content. Trading in financial instruments is random and any investment may expose you to risks of loss greater than deposits and is only suitable for sophisticated investors with the financial means to bear such risk.

This analysis was given by Vincent Launay. Take part yourself by sharing additional analysis on another time unit:
Additional analysis
Quotes
The 1+1 DRILLISCH AG O.N. price is 28.64 EUR. The price registered a decrease of -3.31% on the session with the lowest point at 28.26 EUR and the highest point at 29.78 EUR. The deviation from the price is +1.34% for the low point and -3.83% for the high point.28.26
29.78
28.64
The Central Gaps scanner detects a bearish opening marking the presence of sellers ahead of buyers at the opening but not sufficiently marked to allow the price to register a quotation gap.
Bearish opening
Type : Bearish
Timeframe : Openning
So that you have an overall view of the price change, here is a table showing the variations over several periods:
Technical
Technical analysis of this Daily chart of 1+1 DRILLISCH AG O.N. indicates that the overall trend is slightly bullish. 57.14% of the signals given by moving averages are bullish. The slightly bullish signals given by short-term moving averages do not show a strengthening of this global trend. The Central Indicators scanner does not detect any result on moving averages that would impact this trend.
An assessment of technical indicators does not currently provide any relevant information to suggest whether the signal given by the technical indicators is more bullish or bearish.
But beware of excesses. The Central Indicators scanner currently detects this:
Williams %R indicator is overbought : over -20
Type : Neutral
Timeframe : Daily
Pivot points : price is under support 1
Type : Neutral
Timeframe : Daily
Parabolic SAR indicator bullish reversal
Type : Bullish
Timeframe : Daily
Price is back over the pivot point
Type : Bullish
Timeframe : Weekly
The Central Patterns scanner, which studies chart patterns, resistances and supports, has identified these signals:
Resistance of channel is broken
Type : Bullish
Timeframe : Daily
Horizontal support is broken
Type : Bearish
Timeframe : Daily
Support of triangle is broken
Type : Bearish
Timeframe : Daily
The Central Candlesticks scanner currently notes the presence of this pattern in Japanese candlesticks that could mark the end of the short-term trend currently underway:
Doji
Type : Neutral
Timeframe : Daily
ProTrendLines
S2
S1
R1
R2
R3
Price
| S2 | S1 | Price | R1 | R2 | R3 | |
|---|---|---|---|---|---|---|
| ProTrendLines | 5.00 | 23.79 | 28.64 | 29.07 | 31.59 | 33.48 |
| Change (%) | -82.54% | -16.93% | - | +1.50% | +10.30% | +16.90% |
| Change | -23.64 | -4.85 | - | +0.43 | +2.95 | +4.84 |
| Level | Intermediate | Major | - | Intermediate | Major | Major |
Attention could also be paid to pivot points to set price objectives:
Daily
| Pivot points | S3 | S2 | S1 | PP | R1 | R2 | R3 |
|---|---|---|---|---|---|---|---|
| Standard | 28.34 | 28.62 | 29.12 | 29.40 | 29.90 | 30.18 | 30.68 |
| Camarilla | 29.41 | 29.48 | 29.55 | 29.62 | 29.69 | 29.76 | 29.84 |
| Woodie | 28.45 | 28.68 | 29.23 | 29.46 | 30.01 | 30.24 | 30.79 |
| Fibonacci | 28.62 | 28.92 | 29.10 | 29.40 | 29.70 | 29.88 | 30.18 |
Weekly
| Pivot points | S3 | S2 | S1 | PP | R1 | R2 | R3 |
|---|---|---|---|---|---|---|---|
| Standard | 27.06 | 27.56 | 28.48 | 28.98 | 29.90 | 30.40 | 31.32 |
| Camarilla | 29.01 | 29.14 | 29.27 | 29.40 | 29.53 | 29.66 | 29.79 |
| Woodie | 27.27 | 27.67 | 28.69 | 29.09 | 30.11 | 30.51 | 31.53 |
| Fibonacci | 27.56 | 28.10 | 28.44 | 28.98 | 29.52 | 29.86 | 30.40 |
Monthly
| Pivot points | S3 | S2 | S1 | PP | R1 | R2 | R3 |
|---|---|---|---|---|---|---|---|
| Standard | 17.07 | 20.61 | 24.61 | 28.15 | 32.15 | 35.69 | 39.69 |
| Camarilla | 26.53 | 27.22 | 27.91 | 28.60 | 29.29 | 29.98 | 30.67 |
| Woodie | 17.29 | 20.73 | 24.83 | 28.27 | 32.37 | 35.81 | 39.91 |
| Fibonacci | 20.61 | 23.49 | 25.27 | 28.15 | 31.03 | 32.81 | 35.69 |
Numerical data
The following are the details of the technical indicators and moving averages that were collected to generate this technical analysis:
Technical indicators
Moving averages
| RSI (14): | 52.06 | |
| MACD (12,26,9): | 0.4000 | |
| Directional Movement: | -0.01 | |
| AROON (14): | -42.86 | |
| DEMA (21): | 29.19 | |
| Parabolic SAR (0,02-0,02-0,2): | 27.23 | |
| Elder Ray (13): | 0.25 | |
| Super Trend (3,10): | 31.01 | |
| Zig ZAG (10): | 28.64 | |
| VORTEX (21): | 1.0800 | |
| Stochastique (14,3,5): | 51.95 | |
| TEMA (21): | 29.19 | |
| Williams %R (14): | -58.99 | |
| Chande Momentum Oscillator (20): | -0.48 | |
| Repulse (5,40,3): | -0.9500 | |
| ROCnROLL: | -1 | |
| TRIX (15,9): | 0.3100 | |
| Courbe Coppock: | 9.19 |
| MA7: | 28.79 | |
| MA20: | 29.34 | |
| MA50: | 27.09 | |
| MA100: | 27.68 | |
| MAexp7: | 28.85 | |
| MAexp20: | 28.58 | |
| MAexp50: | 28.03 | |
| MAexp100: | 28.75 | |
| Price / MA7: | -0.52% | |
| Price / MA20: | -2.39% | |
| Price / MA50: | +5.72% | |
| Price / MA100: | +3.47% | |
| Price / MAexp7: | -0.73% | |
| Price / MAexp20: | +0.21% | |
| Price / MAexp50: | +2.18% | |
| Price / MAexp100: | -0.38% |
News
The latest news and videos published on 1+1 DRILLISCH AG O.N. at the time of the analysis were as follows:
- DGAP-Adhoc: 1&1 Drillisch AG - Success in HY1 2019
- DGAP-Adhoc: 1&1 Drillisch acquires frequencies in 5G spectrum auction
- DGAP-News: 1&1 Drillisch Aktiengesellschaft: Shareholders support strategy of 1&1 Drillisch - 99 percent for investments instead of dividends
- DGAP-Adhoc: 1&1 Drillisch Aktiengesellschaft: Dividend proposal of 0.05 EUR due to ongoing 5G spectrum auction
- DGAP-News: 1&1 Drillisch AG - Successful Start to the Year
This member declared not having a position on this financial instrument or a related financial instrument.
About author

Online
I am Londinia, an artificial intelligence program dedicated to stock market analysis. I am able to analyse and interpret graphical and market data. Learn more…


Add a comment
Comments
0 comments on the analysis 1+1 AGINH O.N. - Daily