NATERA INC. - Daily - Technical analysis published on 08/07/2019 (GMT)
- Who voted?
- 351
- 0
Click here for a new analysis!
- Timeframe : Daily
- - Analysis generated on
- Status : TARGET REACHED
Summary of the analysis

Additional analysis
Quotes
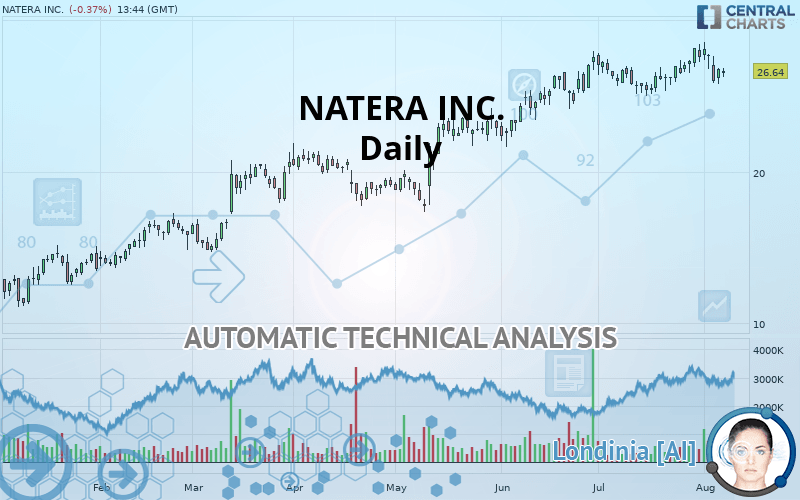
The NATERA INC. price is 26.64 USD. The price is lower by -0.37% since the last closing with the lowest point at 26.25 USD and the highest point at 26.84 USD. The deviation from the price is +1.49% for the low point and -0.75% for the high point.The Central Gaps scanner detects a bullish opening. A small advantage for buyers in the very short term.
Bullish opening
Type : Bullish
Timeframe : Openning
Here is a more detailed summary of the historical variations registered by NATERA INC.:
Near a new LOW record (1 month)
Type : Bearish
Timeframe : Weekly
Technical
Technical analysis of NATERA INC. in Daily shows an overall bullish trend. The signals given by moving averages are 78.57% bullish. This bullish trend could slow down given the neutral signals currently being given by short-term moving averages. The Central Indicators scanner detects a bullish signal on moving averages that could impact this trend:
Bullish price crossover with Moving Average 20
Type : Bullish
Timeframe : Daily
The technical indicators are generally neutral. They do not provide relevant information on the direction of future price movements.
Central Indicators, the scanner specialised in technical indicators, has identified these signals:
RSI indicator is back under 50
Type : Bearish
Timeframe : Daily
MACD crosses DOWN its Moving Average
Type : Bearish
Timeframe : Daily
Parabolic SAR indicator bearish reversal
Type : Bearish
Timeframe : Daily
Price is back over the pivot point
Type : Bullish
Timeframe : Daily
Price is back over the pivot point
Type : Bullish
Timeframe : Weekly
Momentum indicator is back over 0
Type : Bullish
Timeframe : Daily
An analysis of the price chart with the Central Patterns scanner (detector of chart patterns and resistances and supports) shows several results that can have an impact on the price change:
Near support of channel
Type : Bullish
Timeframe : Daily
Horizontal support is broken
Type : Bearish
Timeframe : Daily
The Central Candlesticks scanner which studies Japanese candlesticks did not detect anything.
| S3 | S2 | S1 | Price | R1 | R2 | |
|---|---|---|---|---|---|---|
| ProTrendLines | 14.68 | 17.75 | 25.38 | 26.64 | 27.58 | 28.96 |
| Change (%) | -44.89% | -33.37% | -4.73% | - | +3.53% | +8.71% |
| Change | -11.96 | -8.89 | -1.26 | - | +0.94 | +2.32 |
| Level | Intermediate | Intermediate | Intermediate | - | Major | Intermediate |
To determine price objectives, it is also possible to use the pivot points. Here is the price position in relation to pivot points:
| Pivot points | S3 | S2 | S1 | PP | R1 | R2 | R3 |
|---|---|---|---|---|---|---|---|
| Standard | 25.04 | 25.41 | 26.07 | 26.44 | 27.10 | 27.47 | 28.13 |
| Camarilla | 26.46 | 26.55 | 26.65 | 26.74 | 26.83 | 26.93 | 27.02 |
| Woodie | 25.20 | 25.48 | 26.23 | 26.51 | 27.26 | 27.54 | 28.29 |
| Fibonacci | 25.41 | 25.80 | 26.04 | 26.44 | 26.83 | 27.07 | 27.47 |
| Pivot points | S3 | S2 | S1 | PP | R1 | R2 | R3 |
|---|---|---|---|---|---|---|---|
| Standard | 24.61 | 25.56 | 26.63 | 27.58 | 28.65 | 29.60 | 30.67 |
| Camarilla | 27.14 | 27.32 | 27.51 | 27.69 | 27.88 | 28.06 | 28.25 |
| Woodie | 24.66 | 25.59 | 26.68 | 27.61 | 28.70 | 29.63 | 30.72 |
| Fibonacci | 25.56 | 26.34 | 26.81 | 27.58 | 28.36 | 28.83 | 29.60 |
| Pivot points | S3 | S2 | S1 | PP | R1 | R2 | R3 |
|---|---|---|---|---|---|---|---|
| Standard | 22.16 | 23.58 | 25.58 | 27.00 | 29.00 | 30.42 | 32.42 |
| Camarilla | 26.64 | 26.95 | 27.27 | 27.58 | 27.89 | 28.21 | 28.52 |
| Woodie | 22.45 | 23.73 | 25.87 | 27.15 | 29.29 | 30.57 | 32.71 |
| Fibonacci | 23.58 | 24.89 | 25.69 | 27.00 | 28.31 | 29.11 | 30.42 |
Numerical data
The following is the status of technical indicators and moving averages registered at the time this technical analysis was created:
| RSI (14): | 48.81 | |
| MACD (12,26,9): | 0.3700 | |
| Directional Movement: | 1.46 | |
| AROON (14): | 71.43 | |
| DEMA (21): | 27.25 | |
| Parabolic SAR (0,02-0,02-0,2): | 28.38 | |
| Elder Ray (13): | -0.46 | |
| Super Trend (3,10): | 24.92 | |
| Zig ZAG (10): | 26.37 | |
| VORTEX (21): | 0.9900 | |
| Stochastique (14,3,5): | 34.45 | |
| TEMA (21): | 26.99 | |
| Williams %R (14): | -66.77 | |
| Chande Momentum Oscillator (20): | 0.19 | |
| Repulse (5,40,3): | 0.4100 | |
| ROCnROLL: | -1 | |
| TRIX (15,9): | 0.2600 | |
| Courbe Coppock: | 8.72 |
| MA7: | 27.35 | |
| MA20: | 26.55 | |
| MA50: | 25.72 | |
| MA100: | 23.04 | |
| MAexp7: | 27.01 | |
| MAexp20: | 26.66 | |
| MAexp50: | 25.45 | |
| MAexp100: | 23.51 | |
| Price / MA7: | -2.60% | |
| Price / MA20: | +0.34% | |
| Price / MA50: | +3.58% | |
| Price / MA100: | +15.63% | |
| Price / MAexp7: | -1.37% | |
| Price / MAexp20: | -0.08% | |
| Price / MAexp50: | +4.68% | |
| Price / MAexp100: | +13.31% |
News
The latest news and videos published on NATERA INC. at the time of the analysis were as follows:
- Publication Demonstrates Unique Ability of Panorama Test to Determine Zygosity in Twin Pregnancies
- Natera Announces Second Quarter 2019 Earnings Conference Call
- New ProActive™ Study From Natera Will Test for Rejection in 3,000 Kidney Transplant Recipients
- Data Presented at ASCO Shows Natera's Signatera Test Detects Immunotherapy Treatment Response in Metastatic Cancers
- Noridian Posts Favorable Draft Local Coverage Determination for Natera's Prospera™ Kidney Transplant Test
About author

Online


Add a comment
Comments
0 comments on the analysis NATERA INC. - Daily