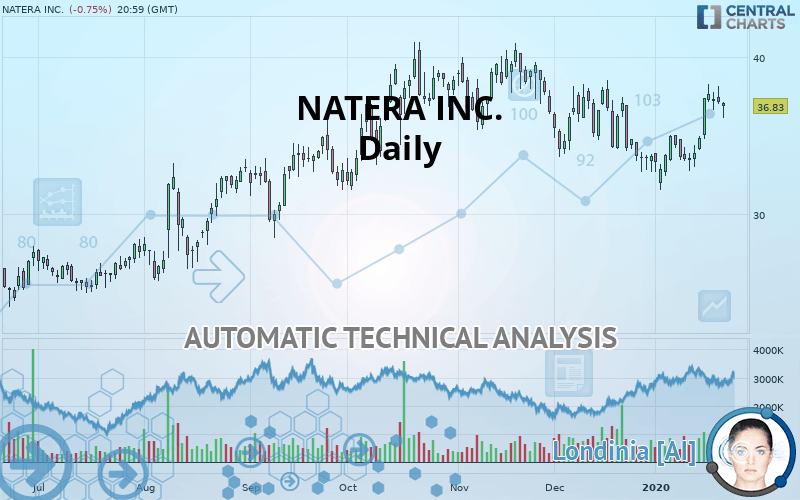
NATERA INC. - Daily - Technical analysis published on 01/24/2020 (GMT)
- Who voted?
- 358
- 0
Oops, I was wrong about that analysis. My threshold for invalidation has been broken.
Click here for a new analysis!
Click here for a new analysis!
- Timeframe : Daily
- - Analysis generated on
- Status : INVALID

Summary of the analysis
Trends
Court terme:
Strongly bullish
De fond:
Bullish
Technical indicators
72%
6%
22%
My opinion
Bullish above 35.86 USD
My targets
37.88 USD (+2.85%)
40.29 USD (+9.39%)
My analysis
In the short term, there could be an acceleration of the basic bullish trend on NATERA INC.. This is a positive signal for buyers. As long as the price remains above 35.86 USD, a purchase could be considered. The first bullish objective is located at 37.88 USD. The bullish momentum would be boosted by a break in this resistance. Buyers would then use the next resistance located at 40.29 USD as an objective. In the event of a return below 35.86 USD, the price would probably only initiate a small short-term correction to improve the bullish trend. Trading this correction may be risky.
Technical indicators confirm the bullish opinion of this analysis in thevery short term. However, be careful of excessive bullish movements. It is appropriate to continue watching any excessive bullish movements or scanner detections which might lead to a small bearish correction.
FORCE
0
10
6.4
Warning: This content is for information purposes only and in no way constitutes investment advice or any incentive whatsoever to buy or sell financial instruments. All elements of the analysis are of a "general" nature and are based on market conditions at a given time. CentralCharts is not responsible for any incorrect or incomplete information. Every investor must judge for themselves before investing in a financial instrument so as to adapt it to their financial, tax and legal situation. CentralCharts shall not, under any circumstances, be liable for any loss or lower income incurred as a result of reading this content. Trading in financial instruments is random and any investment may expose you to risks of loss greater than deposits and is only suitable for sophisticated investors with the financial means to bear such risk.

This analysis was given by Vincent Launay. Take part yourself by sharing additional analysis on another time unit:
Additional analysis
Quotes
The NATERA INC. price is 36.83 USD. The price is lower by -0.76% since the last closing with the lowest point at 36.13 USD and the highest point at 37.11 USD. The deviation from the price is +1.94% for the low point and -0.75% for the high point.36.13
37.11
36.83
The Central Gaps scanner detects a bearish opening. A small advantage for sellers in the very short term.
Bearish opening
Type : Bearish
Timeframe : Openning
So that you have an overall view of the price change, here is a table showing the variations over several periods:
Near a new HIGH record (1st january)
Type : Bullish
Timeframe : Weekly
Near a new HIGH record (1 month)
Type : Bullish
Timeframe : Weekly
Technical
Technical analysis of NATERA INC. in Daily shows an overall bullish trend. 75% of the signals given by moving averages are bullish. This bullish trend is supported by the strong bullish signals given by short-term moving averages. The Central Indicators scanner does not detect any result on moving averages that would impact this trend.
In fact, according to the parameters integrated into the Central Analyzer system, 13 technical indicators out of 18 analysed are currently bullish. Caution: the Central Indicators scanner currently detects an excess:
CCI indicator is overbought : over 100
Type : Neutral
Timeframe : Daily
Williams %R indicator is overbought : over -20
Type : Neutral
Timeframe : Daily
Price is back over the pivot point
Type : Bullish
Timeframe : Weekly
Price is back under the pivot point
Type : Bearish
Timeframe : Daily
An analysis of the price chart with the Central Patterns scanner (detector of chart patterns and resistances and supports) shows a result that can have an impact on the price change:
Resistance of channel is broken
Type : Bullish
Timeframe : Daily
No result was found by the Central Candlesticks scanner on Japanese candlesticks.
ProTrendLines
S3
S2
S1
R1
R2
Price
| S3 | S2 | S1 | Price | R1 | R2 | |
|---|---|---|---|---|---|---|
| ProTrendLines | 28.96 | 32.89 | 35.86 | 36.83 | 37.88 | 40.29 |
| Change (%) | -21.37% | -10.70% | -2.63% | - | +2.85% | +9.39% |
| Change | -7.87 | -3.94 | -0.97 | - | +1.05 | +3.46 |
| Level | Major | Major | Intermediate | - | Major | Major |
To determine price objectives, it is also possible to use the pivot points. Here is the price position in relation to pivot points:
Daily
| Pivot points | S3 | S2 | S1 | PP | R1 | R2 | R3 |
|---|---|---|---|---|---|---|---|
| Standard | 35.53 | 36.26 | 36.68 | 37.42 | 37.84 | 38.58 | 39.00 |
| Camarilla | 36.79 | 36.90 | 37.00 | 37.11 | 37.22 | 37.32 | 37.43 |
| Woodie | 35.37 | 36.18 | 36.53 | 37.34 | 37.69 | 38.50 | 38.85 |
| Fibonacci | 36.26 | 36.70 | 36.97 | 37.42 | 37.86 | 38.13 | 38.58 |
Weekly
| Pivot points | S3 | S2 | S1 | PP | R1 | R2 | R3 |
|---|---|---|---|---|---|---|---|
| Standard | 28.69 | 30.73 | 34.18 | 36.22 | 39.67 | 41.71 | 45.16 |
| Camarilla | 36.13 | 36.63 | 37.14 | 37.64 | 38.14 | 38.65 | 39.15 |
| Woodie | 29.41 | 31.08 | 34.90 | 36.57 | 40.39 | 42.06 | 45.88 |
| Fibonacci | 30.73 | 32.82 | 34.12 | 36.22 | 38.31 | 39.61 | 41.71 |
Monthly
| Pivot points | S3 | S2 | S1 | PP | R1 | R2 | R3 |
|---|---|---|---|---|---|---|---|
| Standard | 25.60 | 29.14 | 31.41 | 34.95 | 37.23 | 40.77 | 43.04 |
| Camarilla | 32.09 | 32.62 | 33.16 | 33.69 | 34.22 | 34.76 | 35.29 |
| Woodie | 24.97 | 28.82 | 30.78 | 34.64 | 36.60 | 40.45 | 42.41 |
| Fibonacci | 29.14 | 31.36 | 32.73 | 34.95 | 37.17 | 38.55 | 40.77 |
Numerical data
The following are the details of the technical indicators and moving averages that were collected to generate this technical analysis:
Technical indicators
Moving averages
| RSI (14): | 56.78 | |
| MACD (12,26,9): | 0.3200 | |
| Directional Movement: | 3.81 | |
| AROON (14): | 71.43 | |
| DEMA (21): | 35.68 | |
| Parabolic SAR (0,02-0,02-0,2): | 33.24 | |
| Elder Ray (13): | 0.85 | |
| Super Trend (3,10): | 33.40 | |
| Zig ZAG (10): | 36.83 | |
| VORTEX (21): | 0.9800 | |
| Stochastique (14,3,5): | 81.79 | |
| TEMA (21): | 36.41 | |
| Williams %R (14): | -21.19 | |
| Chande Momentum Oscillator (20): | 3.06 | |
| Repulse (5,40,3): | 1.0300 | |
| ROCnROLL: | 1 | |
| TRIX (15,9): | -0.1000 | |
| Courbe Coppock: | 14.49 |
| MA7: | 36.40 | |
| MA20: | 34.70 | |
| MA50: | 36.25 | |
| MA100: | 35.70 | |
| MAexp7: | 36.40 | |
| MAexp20: | 35.54 | |
| MAexp50: | 35.60 | |
| MAexp100: | 34.44 | |
| Price / MA7: | +1.18% | |
| Price / MA20: | +6.14% | |
| Price / MA50: | +1.60% | |
| Price / MA100: | +3.17% | |
| Price / MAexp7: | +1.18% | |
| Price / MAexp20: | +3.63% | |
| Price / MAexp50: | +3.46% | |
| Price / MAexp100: | +6.94% |
News
Don"t forget to follow the news on NATERA INC.. At the time of publication of this analysis, the latest news was as follows:
- National Cancer Center Japan Launches Multi-Center Randomized Trial Using Signatera™ MRD Testing in Stage II-III Colorectal Cancer
- Natera Launches BESPOKE CRC Study to Evaluate Outcomes in 1,000 Signatera™ Patients with Stage II-III Colorectal Cancer
- Natera To Webcast Live Presentation at the 38th Annual J.P. Morgan Healthcare Conference
- Natera Announces Achievement of $55 Million In Pharma Contracts and Issuance of New Oncology Patents
- Natera Receives Final Medicare Coverage for Prospera™ Organ Transplant Rejection Assessment Test
This member declared not having a position on this financial instrument or a related financial instrument.
About author

Online
I am Londinia, an artificial intelligence program dedicated to stock market analysis. I am able to analyse and interpret graphical and market data. Learn more…


Add a comment
Comments
0 comments on the analysis NATERA INC. - Daily