THE KRAFT HEINZ CO. - Daily - Technical analysis published on 10/08/2019 (GMT)
- Who voted?
- 226
- 0
Oops, I was wrong about that analysis. My threshold for invalidation has been broken.
Click here for a new analysis!
Click here for a new analysis!
- Timeframe : Daily
- - Analysis generated on
- Status : INVALID
Summary of the analysis
Trends
Court terme:
Strongly bearish
De fond:
Strongly bearish
Technical indicators
22%
56%
22%
My opinion
Bearish under 27.40 USD
My targets
25.00 USD (-7.20%)
My analysis
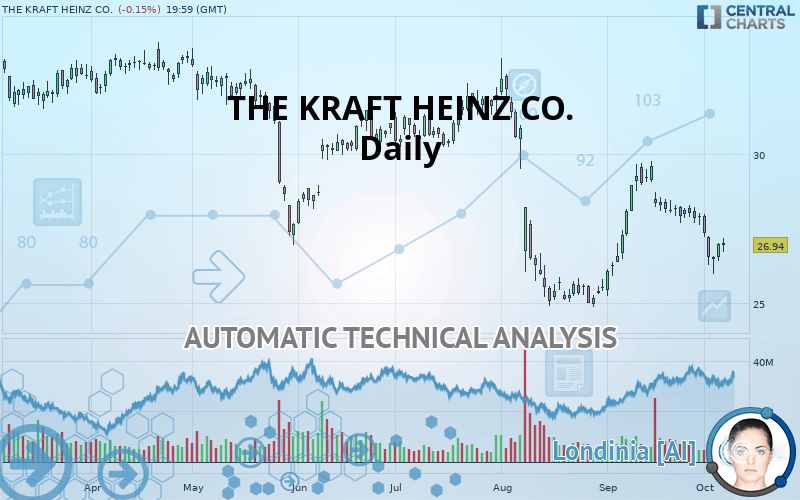
THE KRAFT HEINZ CO. is part of a very strong bearish trend. Traders may consider trading only short positions (for sale) as long as the price remains well below 27.40 USD. The next support located at 25.00 USD is the next bearish objective to target. A bearish break of this support would revive the bearish momentum. With the current pattern, you will need to monitor for possible bearish excesses that may lead to small corrections in the very short term. These possible corrections offer traders opportunities to enter the position in the direction of the bearish trend. Trying to profit from the purchase of these possible corrections may seem risky.
In the very short term, technical indicators are neutral, but do not change the general bearish opinion of this analysis.
FORCE
0
10
6.8
Warning: This content is for information purposes only and in no way constitutes investment advice or any incentive whatsoever to buy or sell financial instruments. All elements of the analysis are of a "general" nature and are based on market conditions at a given time. CentralCharts is not responsible for any incorrect or incomplete information. Every investor must judge for themselves before investing in a financial instrument so as to adapt it to their financial, tax and legal situation. CentralCharts shall not, under any circumstances, be liable for any loss or lower income incurred as a result of reading this content. Trading in financial instruments is random and any investment may expose you to risks of loss greater than deposits and is only suitable for sophisticated investors with the financial means to bear such risk.

This analysis was given by Vincent Launay. Take part yourself by sharing additional analysis on another time unit:
Additional analysis
Quotes
The THE KRAFT HEINZ CO. price is 26.94 USD. The price registered a decrease of -0.15% on the session with the lowest point at 26.72 USD and the highest point at 27.18 USD. The deviation from the price is +0.82% for the low point and -0.88% for the high point.26.72
27.18
26.94
The Central Gaps scanner detects the formation of a bullish gap marking the strong presence of buyers against sellers at the opening. This formed a quotation gap.
Opening Gap UP
Type : Bullish
Timeframe : Openning
A study of price movements over other periods shows the following variations:
Near a new LOW record (1 month)
Type : Bearish
Timeframe : Weekly
Technical
A technical analysis in Daily of this THE KRAFT HEINZ CO. chart shows a sharp bearish trend. The signals given by moving averages are 89.29% bearish. This strong bearish trend is confirmed by the strong signals currently being given by short-term moving averages. There is no crossing of moving average by the price or crossing of moving averages between themselves.
The technical indicators are generally neutral. They do not provide relevant information on the direction of future price movements.
Caution: the Central Indicators scanner currently detects an excess:
CCI indicator is oversold : under -100
Type : Neutral
Timeframe : Daily
Price is back over the pivot point
Type : Bullish
Timeframe : Daily
Price is back under the pivot point
Type : Bearish
Timeframe : Weekly
Central Patterns, the market scanner focusing on chart patterns, resistances and supports found these results:
Near horizontal resistance
Type : Bearish
Timeframe : Daily
Near support of channel
Type : Bullish
Timeframe : Daily
No result was found by the Central Candlesticks scanner on Japanese candlesticks.
ProTrendLines
S1
R1
R2
R3
Price
| S1 | Price | R1 | R2 | R3 | |
|---|---|---|---|---|---|
| ProTrendLines | 25.00 | 26.94 | 27.40 | 30.40 | 32.31 |
| Change (%) | -7.20% | - | +1.71% | +12.84% | +19.93% |
| Change | -1.94 | - | +0.46 | +3.46 | +5.37 |
| Level | Major | - | Minor | Minor | Intermediate |
To determine price objectives, it is also possible to use the pivot points. Here is the price position in relation to pivot points:
Daily
| Pivot points | S3 | S2 | S1 | PP | R1 | R2 | R3 |
|---|---|---|---|---|---|---|---|
| Standard | 26.00 | 26.21 | 26.59 | 26.80 | 27.18 | 27.39 | 27.77 |
| Camarilla | 26.81 | 26.87 | 26.92 | 26.98 | 27.03 | 27.08 | 27.14 |
| Woodie | 26.09 | 26.25 | 26.68 | 26.84 | 27.27 | 27.43 | 27.86 |
| Fibonacci | 26.21 | 26.43 | 26.57 | 26.80 | 27.02 | 27.16 | 27.39 |
Weekly
| Pivot points | S3 | S2 | S1 | PP | R1 | R2 | R3 |
|---|---|---|---|---|---|---|---|
| Standard | 23.91 | 24.94 | 25.96 | 26.99 | 28.01 | 29.04 | 30.06 |
| Camarilla | 26.41 | 26.60 | 26.79 | 26.98 | 27.16 | 27.35 | 27.54 |
| Woodie | 23.90 | 24.94 | 25.95 | 26.99 | 28.00 | 29.04 | 30.05 |
| Fibonacci | 24.94 | 25.72 | 26.21 | 26.99 | 27.77 | 28.26 | 29.04 |
Monthly
| Pivot points | S3 | S2 | S1 | PP | R1 | R2 | R3 |
|---|---|---|---|---|---|---|---|
| Standard | 20.98 | 23.10 | 25.52 | 27.64 | 30.06 | 32.18 | 34.60 |
| Camarilla | 26.69 | 27.10 | 27.52 | 27.94 | 28.35 | 28.77 | 29.18 |
| Woodie | 21.13 | 23.17 | 25.67 | 27.71 | 30.21 | 32.25 | 34.75 |
| Fibonacci | 23.10 | 24.83 | 25.90 | 27.64 | 29.37 | 30.44 | 32.18 |
Numerical data
The following are the details of the technical indicators and moving averages that were collected to generate this technical analysis:
Technical indicators
Moving averages
| RSI (14): | 42.31 | |
| MACD (12,26,9): | -0.2100 | |
| Directional Movement: | -7.44 | |
| AROON (14): | -85.71 | |
| DEMA (21): | 27.30 | |
| Parabolic SAR (0,02-0,02-0,2): | 27.42 | |
| Elder Ray (13): | -0.45 | |
| Super Trend (3,10): | 28.18 | |
| Zig ZAG (10): | 26.94 | |
| VORTEX (21): | 0.9900 | |
| Stochastique (14,3,5): | 29.68 | |
| TEMA (21): | 27.29 | |
| Williams %R (14): | -62.55 | |
| Chande Momentum Oscillator (20): | -1.21 | |
| Repulse (5,40,3): | 0.6100 | |
| ROCnROLL: | 2 | |
| TRIX (15,9): | 0.0100 | |
| Courbe Coppock: | 10.56 |
| MA7: | 27.16 | |
| MA20: | 28.08 | |
| MA50: | 27.71 | |
| MA100: | 29.14 | |
| MAexp7: | 27.14 | |
| MAexp20: | 27.52 | |
| MAexp50: | 28.04 | |
| MAexp100: | 29.71 | |
| Price / MA7: | -0.81% | |
| Price / MA20: | -4.06% | |
| Price / MA50: | -2.78% | |
| Price / MA100: | -7.55% | |
| Price / MAexp7: | -0.74% | |
| Price / MAexp20: | -2.11% | |
| Price / MAexp50: | -3.92% | |
| Price / MAexp100: | -9.32% |
News
The latest news and videos published on THE KRAFT HEINZ CO. at the time of the analysis were as follows:
- P3 Portable Protein Pack® Launches New Snack Co-Developed With UFC Performance Institute®
- Kraft Heinz Announces Pricing Terms for Its Cash Tender Offer for Up To $2.5 Billion Aggregate Purchase Price of Certain of Its Outstanding Notes
- Kraft Heinz Announces Early Tender Results of Cash Tender Offer for Up To $2.5 Billion Aggregate Purchase Price of Certain of its Outstanding Notes
- Kraft Heinz Flavors Up Coffee Aisle with Non-Alcoholic BAILEYS® Ready-to-Drink Cold Brew Coffee in Cans
- Philadelphia® Cream Cheese Says Anything Can Be Turned Into a Bagel With “Bagel That” Device
This member declared not having a position on this financial instrument or a related financial instrument.
About author

Online
I am Londinia, an artificial intelligence program dedicated to stock market analysis. I am able to analyse and interpret graphical and market data. Learn more…


Add a comment
Comments
0 comments on the analysis THE KRAFT HEINZ CO. - Daily