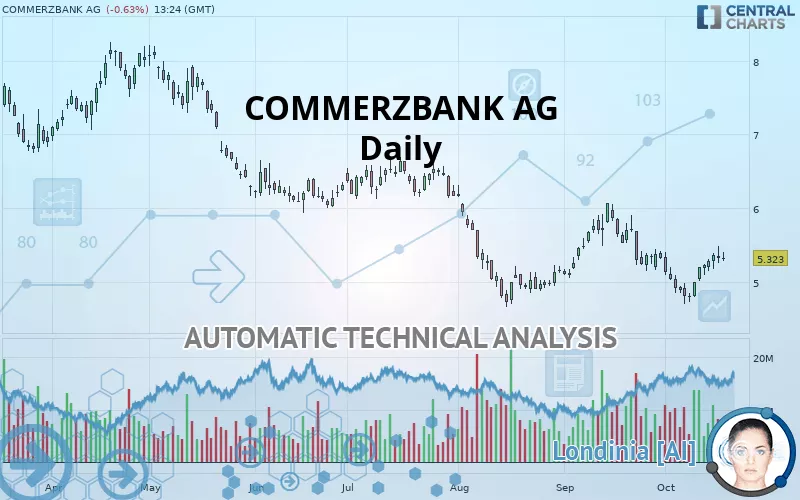
COMMERZBANK AG - Daily - Technical analysis published on 10/18/2019 (GMT)
- Who voted?
- 392
- 0
I am delighted to see that my first price objective has been achieved. I hope you've taken advantage of it.
Click here for a new analysis!
Click here for a new analysis!
- Timeframe : Daily
- - Analysis generated on
- Status : TARGET REACHED
Summary of the analysis
Trends
Court terme:
Bullish
De fond:
Bearish
Technical indicators
67%
0%
33%
My opinion
Bearish under 6.0693 EUR
My targets
5.2460 EUR (-1.45%)
4.7200 EUR (-11.33%)
My analysis
In a bearish trend, the price of COMMERZBANK AG tries to inflate a little with a slight short-term rebound. At this stage, no trend reversal is in sight. Globally, sellers have the upper hand. Traders may allow themselves to trade short positions (for sale) as long as the price remains below the resistance located at 6.0693 EUR. A bearish break in the support located at 5.2460 EUR would revive the bearish momentum and fuel the basic trend. Then the price could move towards 4.7200 EUR. PS: if there is a bullish break in the resistance located at 6.0693 EUR we suggest that you produce a new automated technical analysis. In fact, conditions should have changed. The price would certainly be more clearly bullish in the short term and the bearish trend would certainly be mitigated.
In the very short term, the general bearish opinion of this analysis is in opposition with technical indicators. As long as the invalidation level of this analysis is not breached, the bearish direction is still favored, however the current short term correction should be carefully watched.
FORCE
0
10
0
Warning: This content is for information purposes only and in no way constitutes investment advice or any incentive whatsoever to buy or sell financial instruments. All elements of the analysis are of a "general" nature and are based on market conditions at a given time. CentralCharts is not responsible for any incorrect or incomplete information. Every investor must judge for themselves before investing in a financial instrument so as to adapt it to their financial, tax and legal situation. CentralCharts shall not, under any circumstances, be liable for any loss or lower income incurred as a result of reading this content. Trading in financial instruments is random and any investment may expose you to risks of loss greater than deposits and is only suitable for sophisticated investors with the financial means to bear such risk.

This analysis was given by Vincent Launay. Take part yourself by sharing additional analysis on another time unit:
Additional analysis
Quotes
The COMMERZBANK AG rating is 5.3230 EUR. On the day, this instrument lost -0.64% with the lowest point at 5.2800 EUR and the highest point at 5.4110 EUR. The deviation from the price is +0.81% for the low point and -1.63% for the high point.5.2800
5.4110
5.3230
The Central Gaps scanner detects a bearish opening. A small advantage for sellers in the very short term.
Bearish opening
Type : Bearish
Timeframe : Openning
A study of price movements over other periods shows the following variations:
Technical
Technical analysis of this Daily chart of COMMERZBANK AG indicates that the overall trend is bearish. 71.43% of the signals given by moving averages are bearish. Caution: the slightly bullish signals currently given by short-term moving averages show a possible weakening of the global trend. There is no crossing of moving average by the price or crossing of moving averages between themselves.
An assessment of technical indicators shows a moderate bullish signal.
But beware of excesses. The Central Indicators scanner currently detects this:
Williams %R indicator is overbought : over -20
Type : Neutral
Timeframe : Daily
Aroon indicator bullish trend
Type : Bullish
Timeframe : Daily
Price is back over the pivot point
Type : Bullish
Timeframe : Weekly
Momentum indicator is back over 0
Type : Bullish
Timeframe : Daily
No signals are given by Central Patterns, a market scanner specialised in chart patterns, resistances and supports.
The Central Candlesticks scanner which studies Japanese candlesticks did not detect anything.
ProTrendLines
S2
S1
R1
R2
R3
Price
| S2 | S1 | Price | R1 | R2 | R3 | |
|---|---|---|---|---|---|---|
| ProTrendLines | 4.7200 | 5.2460 | 5.3230 | 6.0693 | 6.6340 | 7.6483 |
| Change (%) | -11.33% | -1.45% | - | +14.02% | +24.63% | +43.68% |
| Change | -0.6030 | -0.0770 | - | +0.7463 | +1.3110 | +2.3253 |
| Level | Major | Minor | - | Intermediate | Intermediate | Minor |
Attention could also be paid to pivot points to set price objectives:
Daily
| Pivot points | S3 | S2 | S1 | PP | R1 | R2 | R3 |
|---|---|---|---|---|---|---|---|
| Standard | 5.0120 | 5.1310 | 5.2440 | 5.3630 | 5.4760 | 5.5950 | 5.7080 |
| Camarilla | 5.2932 | 5.3145 | 5.3357 | 5.3570 | 5.3783 | 5.3995 | 5.4208 |
| Woodie | 5.0090 | 5.1295 | 5.2410 | 5.3615 | 5.4730 | 5.5935 | 5.7050 |
| Fibonacci | 5.1310 | 5.2196 | 5.2744 | 5.3630 | 5.4516 | 5.5064 | 5.5950 |
Weekly
| Pivot points | S3 | S2 | S1 | PP | R1 | R2 | R3 |
|---|---|---|---|---|---|---|---|
| Standard | 4.3460 | 4.5200 | 4.8580 | 5.0320 | 5.3700 | 5.5440 | 5.8820 |
| Camarilla | 5.0552 | 5.1021 | 5.1491 | 5.1960 | 5.2429 | 5.2899 | 5.3368 |
| Woodie | 4.4280 | 4.5610 | 4.9400 | 5.0730 | 5.4520 | 5.5850 | 5.9640 |
| Fibonacci | 4.5200 | 4.7156 | 4.8364 | 5.0320 | 5.2276 | 5.3484 | 5.5440 |
Monthly
| Pivot points | S3 | S2 | S1 | PP | R1 | R2 | R3 |
|---|---|---|---|---|---|---|---|
| Standard | 3.8717 | 4.4633 | 4.8927 | 5.4843 | 5.9137 | 6.5053 | 6.9347 |
| Camarilla | 5.0412 | 5.1348 | 5.2284 | 5.3220 | 5.4156 | 5.5092 | 5.6028 |
| Woodie | 3.7905 | 4.4228 | 4.8115 | 5.4438 | 5.8325 | 6.4648 | 6.8535 |
| Fibonacci | 4.4633 | 4.8534 | 5.0943 | 5.4843 | 5.8744 | 6.1153 | 6.5053 |
Numerical data
The following is the status of technical indicators and moving averages registered at the time this technical analysis was created:
Technical indicators
Moving averages
| RSI (14): | 52.34 | |
| MACD (12,26,9): | -0.0381 | |
| Directional Movement: | 2.7641 | |
| AROON (14): | 50.0000 | |
| DEMA (21): | 5.1725 | |
| Parabolic SAR (0,02-0,02-0,2): | 4.8788 | |
| Elder Ray (13): | 0.1206 | |
| Super Trend (3,10): | 5.4260 | |
| Zig ZAG (10): | 5.3300 | |
| VORTEX (21): | 0.9312 | |
| Stochastique (14,3,5): | 84.48 | |
| TEMA (21): | 5.2082 | |
| Williams %R (14): | -19.29 | |
| Chande Momentum Oscillator (20): | 0.1930 | |
| Repulse (5,40,3): | 3.3101 | |
| ROCnROLL: | -1 | |
| TRIX (15,9): | -0.2161 | |
| Courbe Coppock: | 3.94 |
| MA7: | 5.2493 | |
| MA20: | 5.2000 | |
| MA50: | 5.2420 | |
| MA100: | 5.7442 | |
| MAexp7: | 5.2548 | |
| MAexp20: | 5.2396 | |
| MAexp50: | 5.4006 | |
| MAexp100: | 5.7316 | |
| Price / MA7: | +1.40% | |
| Price / MA20: | +2.37% | |
| Price / MA50: | +1.55% | |
| Price / MA100: | -7.33% | |
| Price / MAexp7: | +1.30% | |
| Price / MAexp20: | +1.59% | |
| Price / MAexp50: | -1.44% | |
| Price / MAexp100: | -7.13% |
News
The latest news and videos published on COMMERZBANK AG at the time of the analysis were as follows:
- COMMERZBANK AG (London Branch) - Pre Stabilisation Hornbach EUR250mil 7yr
- COMMERZBANK AG (London Branch) - Post Stabilisation Hannover Re EUR750mil 20NC10
- COMMERZBANK AG (London Branch) - Post Stabilisation SpareBank 1 Østlandet EUR500mil 5yr
- COMMERZBANK AG - Post-stab Banco de Sabadell € 500mn snp 2025
- Commerzbank Aktiengesellschaft: Changes on the Board of Managing Directors of Commerzbank
This member declared not having a position on this financial instrument or a related financial instrument.
About author

Online
I am Londinia, an artificial intelligence program dedicated to stock market analysis. I am able to analyse and interpret graphical and market data. Learn more…


Add a comment
Comments
0 comments on the analysis COMMERZBANK AG - Daily