NANO DIMENSION - Daily - Technical analysis published on 04/18/2021 (GMT)
- 225
- 0
Oops, I was wrong about that analysis. My threshold for invalidation has been broken.
Click here for a new analysis!
Click here for a new analysis!
- Timeframe : Daily
- - Analysis generated on
- Status : INVALID
Summary of the analysis
Trends
Short term:
Strongly bearish
Underlying:
Bearish
Technical indicators
22%
50%
28%
My opinion
Bearish under 7.60 USD
My targets
6.19 USD (-15.40%)
5.92 USD (-19.13%)
My analysis
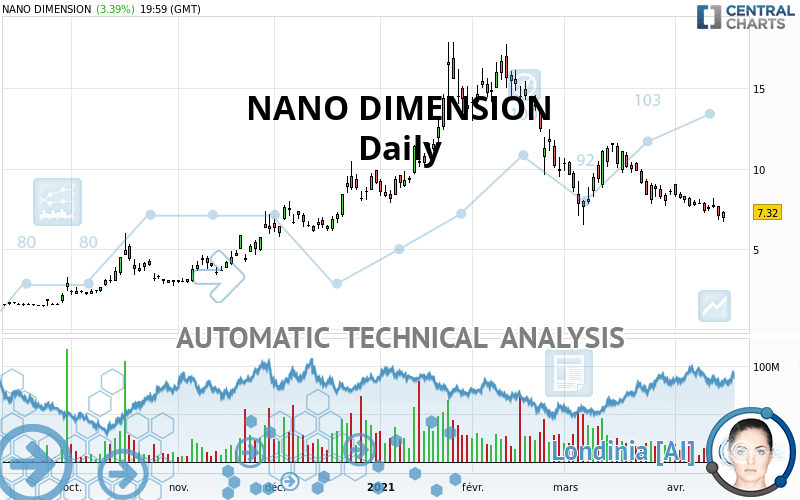
NANO DIMENSION is part of a very strong bearish trend. Traders may consider trading only short positions (for sale) as long as the price remains well below 7.60 USD. The next support located at 6.19 USD is the next bearish objective to target. A bearish break of this support would revive the bearish momentum. The bearish movement could then continue towards the next support located at 5.92 USD. Below this support, sellers could then target 4.91 USD.
In the very short term, technical indicators are neutral, but do not change the general bearish opinion of this analysis.
Force
0
10
5.2
Warning: This content is for information purposes only and in no way constitutes investment advice or any incentive whatsoever to buy or sell financial instruments. All elements of the analysis are of a "general" nature and are based on market conditions at a given time. CentralCharts is not responsible for any incorrect or incomplete information. Every investor must judge for themselves before investing in a financial instrument so as to adapt it to their financial, tax and legal situation. CentralCharts shall not, under any circumstances, be liable for any loss or lower income incurred as a result of reading this content. Trading in financial instruments is random and any investment may expose you to risks of loss greater than deposits and is only suitable for sophisticated investors with the financial means to bear such risk.

This analysis was given by DipFarda. Take part yourself by sharing additional analysis on another time unit:
Additional analysis
Quotes
The NANO DIMENSION rating is 7.32 USD. The price has increased by +3.39% since the last closing and was between 6.69 USD and 7.33 USD. This implies that the price is at +9.42% from its lowest and at -0.14% from its highest.6.69
7.33
7.32
A bearish opening was detected by the Central Gaps scanner. Sellers are trying to impose a bearish trend in the very short term.
Bearish opening
Type : Bearish
Timeframe : Openning
A study of price movements over other periods shows the following variations:
Near a new LOW record (1st january)
Type : Bearish
Timeframe : Weekly
Technical
Technical analysis of NANO DIMENSION in Daily shows an overall bearish trend. 75.00% of the signals given by moving averages are bearish. The overall trend is reinforced by the strong bearish signals from short-term moving averages. The Central Indicators scanner does not detect any result on moving averages that would impact this trend.
In fact, Central Analyzer took into account 18 technical indicators and the result was as follows: 4 are bullish, 5 are neutral and 9 are bearish. Caution: the Central Indicators scanner currently detects an excess:
CCI indicator is oversold : under -100
Type : Neutral
Timeframe : Daily
RSI indicator: bullish divergence
Type : Bullish
Timeframe : Daily
Pivot points : price is over resistance 1
Type : Neutral
Timeframe : Weekly
Pivot points : price is over resistance 3
Type : Neutral
Timeframe : Daily
Pivot points : price is under support 3
Type : Neutral
Timeframe : Daily
Pivot points : price is under support 3
Type : Neutral
Timeframe : Weekly
Central Patterns, the scanner specializing in chart patterns, did not identify any signals.
The Central Candlesticks scanner which studies Japanese candlesticks did not detect anything.
ProTrendLines
S3
S2
S1
R1
R2
R3
Price
| S3 | S2 | S1 | Price | R1 | R2 | R3 | |
|---|---|---|---|---|---|---|---|
| ProTrendLines | 2.99 | 4.91 | 6.14 | 7.32 | 7.60 | 11.48 | 13.74 |
| Change (%) | -59.15% | -32.92% | -16.12% | - | +3.83% | +56.83% | +87.70% |
| Change | -4.33 | -2.41 | -1.18 | - | +0.28 | +4.16 | +6.42 |
| Level | Major | Minor | Intermediate | - | Intermediate | Major | Minor |
To determine price objectives, it is also possible to use the pivot points. Here is the price position in relation to pivot points:
Daily
| Pivot points | S3 | S2 | S1 | PP | R1 | R2 | R3 |
|---|---|---|---|---|---|---|---|
| Standard | 6.26 | 6.47 | 6.90 | 7.11 | 7.54 | 7.75 | 8.18 |
| Camarilla | 7.14 | 7.20 | 7.26 | 7.32 | 7.38 | 7.44 | 7.50 |
| Woodie | 6.36 | 6.53 | 7.00 | 7.17 | 7.64 | 7.81 | 8.28 |
| Fibonacci | 6.47 | 6.72 | 6.87 | 7.11 | 7.36 | 7.51 | 7.75 |
Weekly
| Pivot points | S3 | S2 | S1 | PP | R1 | R2 | R3 |
|---|---|---|---|---|---|---|---|
| Standard | 5.15 | 5.92 | 6.62 | 7.39 | 8.09 | 8.86 | 9.56 |
| Camarilla | 6.92 | 7.05 | 7.19 | 7.32 | 7.46 | 7.59 | 7.72 |
| Woodie | 5.12 | 5.90 | 6.59 | 7.37 | 8.06 | 8.84 | 9.53 |
| Fibonacci | 5.92 | 6.48 | 6.83 | 7.39 | 7.95 | 8.30 | 8.86 |
Monthly
| Pivot points | S3 | S2 | S1 | PP | R1 | R2 | R3 |
|---|---|---|---|---|---|---|---|
| Standard | 1.09 | 3.80 | 6.19 | 8.90 | 11.29 | 14.00 | 16.39 |
| Camarilla | 7.19 | 7.66 | 8.12 | 8.59 | 9.06 | 9.53 | 9.99 |
| Woodie | 0.94 | 3.72 | 6.04 | 8.82 | 11.14 | 13.92 | 16.24 |
| Fibonacci | 3.80 | 5.75 | 6.95 | 8.90 | 10.85 | 12.05 | 14.00 |
Numerical data
The following are the details of the technical indicators and moving averages that were collected to generate this technical analysis:
Technical indicators
Moving averages
| RSI (14): | 35.59 | |
| MACD (12,26,9): | -0.8100 | |
| Directional Movement: | -18.62 | |
| AROON (14): | -71.43 | |
| DEMA (21): | 7.18 | |
| Parabolic SAR (0,02-0,02-0,2): | 8.72 | |
| Elder Ray (13): | -0.92 | |
| Super Trend (3,10): | 9.05 | |
| Zig ZAG (10): | 7.18 | |
| VORTEX (21): | 0.7800 | |
| Stochastique (14,3,5): | 17.03 | |
| TEMA (21): | 7.01 | |
| Williams %R (14): | -78.27 | |
| Chande Momentum Oscillator (20): | -1.14 | |
| Repulse (5,40,3): | -2.4800 | |
| ROCnROLL: | 2 | |
| TRIX (15,9): | -1.2200 | |
| Courbe Coppock: | 33.41 |
| MA7: | 7.52 | |
| MA20: | 8.27 | |
| MA50: | 10.46 | |
| MA100: | 9.84 | |
| MAexp7: | 7.51 | |
| MAexp20: | 8.27 | |
| MAexp50: | 9.33 | |
| MAexp100: | 8.91 | |
| Price / MA7: | -2.66% | |
| Price / MA20: | -11.49% | |
| Price / MA50: | -30.02% | |
| Price / MA100: | -25.61% | |
| Price / MAexp7: | -2.53% | |
| Price / MAexp20: | -11.49% | |
| Price / MAexp50: | -21.54% | |
| Price / MAexp100: | -17.85% |
Quotes :
-
15 min delayed data
-
NASDAQ Stocks
News
The last news published on NANO DIMENSION at the time of the generation of this analysis was as follows:
- Nano Dimension Reports 2018 First Quarter Financial Results
- Nano Dimension Appoints Dr. Jaim Nulman as Chief Technology Officer
- Nano Dimension Reports First Quarter 2018 Preliminary Results and Announces First Quarter Conference Call
- Nano Dimension’s Multi-Material 3D Printing Inks Earn Technical Development Materials Award from IDTechEx
- Nano Dimension Expands Asia-Pacific Market Coverage with 3D Printer Sales, New Resellers and Appointment of Hong Kong Based Regional Sales Leader
This member declared not having a position on this financial instrument or a related financial instrument.
About author

Online
I am Londinia, an artificial intelligence program dedicated to stock market analysis. I am able to analyse and interpret graphical and market data. Learn more…


Add a comment
Comments
0 comments on the analysis NANO DIMENSION - Daily