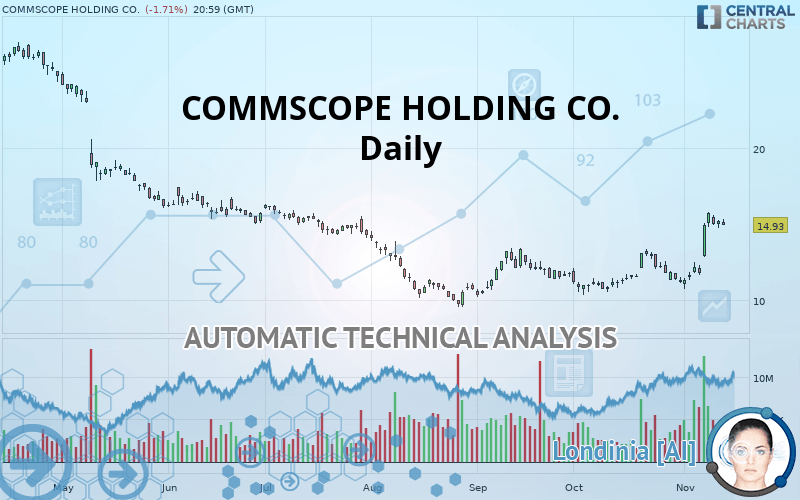
COMMSCOPE HOLDING CO. - Daily - Technical analysis published on 11/14/2019 (GMT)
- Who voted?
- 199
- 0
I am delighted to see that my first price objective has been achieved. I hope you've taken advantage of it.
Click here for a new analysis!
Click here for a new analysis!
- Timeframe : Daily
- - Analysis generated on
- Status : TARGET REACHED

Summary of the analysis
Trends
Court terme:
Strongly bullish
De fond:
Bullish
Technical indicators
78%
6%
17%
My opinion
Bullish above 13.32 USD
My targets
15.10 USD (+1.14%)
20.84 USD (+39.58%)
My analysis
In the short term, there could be an acceleration of the basic bullish trend on COMMSCOPE HOLDING CO.. This is a positive signal for buyers. As long as the price remains above 13.32 USD, a purchase could be considered. The first bullish objective is located at 15.10 USD. The bullish momentum would be boosted by a break in this resistance. Buyers would then use the next resistance located at 20.84 USD as an objective. Crossing it would then enable buyers to target 24.10 USD. In the event of a return below 13.32 USD, the price would probably only initiate a small short-term correction to improve the bullish trend. Trading this correction may be risky.
Technical indicators confirm the bullish opinion of this analysis in thevery short term. However, be careful of excessive bullish movements. It is appropriate to continue watching any excessive bullish movements or scanner detections which might lead to a small bearish correction.
FORCE
0
10
6.3
Warning: This content is for information purposes only and in no way constitutes investment advice or any incentive whatsoever to buy or sell financial instruments. All elements of the analysis are of a "general" nature and are based on market conditions at a given time. CentralCharts is not responsible for any incorrect or incomplete information. Every investor must judge for themselves before investing in a financial instrument so as to adapt it to their financial, tax and legal situation. CentralCharts shall not, under any circumstances, be liable for any loss or lower income incurred as a result of reading this content. Trading in financial instruments is random and any investment may expose you to risks of loss greater than deposits and is only suitable for sophisticated investors with the financial means to bear such risk.

This analysis was given by Vincent Launay. Take part yourself by sharing additional analysis on another time unit:
Additional analysis
Quotes
COMMSCOPE HOLDING CO. rating 14.93 USD. On the day, this instrument lost -1.71% and was traded between 14.91 USD and 15.34 USD over the period. The price is currently at +0.13% from its lowest and -2.67% from its highest.14.91
15.34
14.93
The Central Gaps scanner detects a bearish opening marking the presence of sellers ahead of buyers at the opening but not sufficiently marked to allow the price to register a quotation gap.
Bearish opening
Type : Bearish
Timeframe : Openning
A study of price movements over other periods shows the following variations:
Near a new HIGH record (1 month)
Type : Bullish
Timeframe : Weekly
The Central Volumes scanner notes the presence of abnormal volumes:
Abnormal volumes
Timeframe : 5 days
Technical
Technical analysis of COMMSCOPE HOLDING CO. in Daily shows an overall bullish trend. The signals returned by the moving averages are 71.43% bullish. This bullish trend is reinforced by the strong signals currently being given by short-term moving averages. The Central Indicators scanner does not detect any result on moving averages that would impact this trend.
In fact, 14 technical indicators on 18 studied are currently bullish. But beware of excesses. The Central Indicators scanner currently detects this:
CCI indicator is overbought : over 100
Type : Neutral
Timeframe : Daily
Williams %R indicator is overbought : over -20
Type : Neutral
Timeframe : Daily
Price is back over the pivot point
Type : Bullish
Timeframe : Daily
Price is back over the pivot point
Type : Bullish
Timeframe : Weekly
Central Patterns, the market scanner focusing on chart patterns, resistances and supports found this result:
Near horizontal support
Type : Bullish
Timeframe : Daily
No result was found by the Central Candlesticks scanner on Japanese candlesticks.
ProTrendLines
S2
S1
R1
R2
R3
Price
| S2 | S1 | Price | R1 | R2 | R3 | |
|---|---|---|---|---|---|---|
| ProTrendLines | 9.70 | 13.32 | 14.93 | 15.10 | 20.84 | 24.10 |
| Change (%) | -35.03% | -10.78% | - | +1.14% | +39.58% | +61.42% |
| Change | -5.23 | -1.61 | - | +0.17 | +5.91 | +9.17 |
| Level | Intermediate | Intermediate | - | Major | Intermediate | Minor |
Attention could also be paid to pivot points to set price objectives:
Daily
| Pivot points | S3 | S2 | S1 | PP | R1 | R2 | R3 |
|---|---|---|---|---|---|---|---|
| Standard | 14.39 | 14.56 | 14.88 | 15.05 | 15.37 | 15.54 | 15.86 |
| Camarilla | 15.06 | 15.10 | 15.15 | 15.19 | 15.24 | 15.28 | 15.33 |
| Woodie | 14.46 | 14.60 | 14.95 | 15.09 | 15.44 | 15.58 | 15.93 |
| Fibonacci | 14.56 | 14.75 | 14.87 | 15.05 | 15.24 | 15.36 | 15.54 |
Weekly
| Pivot points | S3 | S2 | S1 | PP | R1 | R2 | R3 |
|---|---|---|---|---|---|---|---|
| Standard | 8.28 | 9.80 | 12.75 | 14.27 | 17.22 | 18.74 | 21.69 |
| Camarilla | 14.47 | 14.88 | 15.29 | 15.70 | 16.11 | 16.52 | 16.93 |
| Woodie | 9.00 | 10.16 | 13.47 | 14.63 | 17.94 | 19.10 | 22.41 |
| Fibonacci | 9.80 | 11.51 | 12.56 | 14.27 | 15.98 | 17.03 | 18.74 |
Monthly
| Pivot points | S3 | S2 | S1 | PP | R1 | R2 | R3 |
|---|---|---|---|---|---|---|---|
| Standard | 6.85 | 8.58 | 9.89 | 11.62 | 12.93 | 14.66 | 15.97 |
| Camarilla | 10.36 | 10.64 | 10.92 | 11.20 | 11.48 | 11.76 | 12.04 |
| Woodie | 6.64 | 8.48 | 9.68 | 11.52 | 12.72 | 14.56 | 15.76 |
| Fibonacci | 8.58 | 9.74 | 10.46 | 11.62 | 12.78 | 13.50 | 14.66 |
Numerical data
The following are the details of the technical indicators and moving averages that were collected to generate this technical analysis:
Technical indicators
Moving averages
| RSI (14): | 66.14 | |
| MACD (12,26,9): | 0.8400 | |
| Directional Movement: | 25.00 | |
| AROON (14): | 35.71 | |
| DEMA (21): | 14.01 | |
| Parabolic SAR (0,02-0,02-0,2): | 11.36 | |
| Elder Ray (13): | 1.55 | |
| Super Trend (3,10): | 12.69 | |
| Zig ZAG (10): | 14.93 | |
| VORTEX (21): | 1.1300 | |
| Stochastique (14,3,5): | 85.33 | |
| TEMA (21): | 14.74 | |
| Williams %R (14): | -16.90 | |
| Chande Momentum Oscillator (20): | 3.17 | |
| Repulse (5,40,3): | 2.6000 | |
| ROCnROLL: | 1 | |
| TRIX (15,9): | 0.5500 | |
| Courbe Coppock: | 32.37 |
| MA7: | 14.24 | |
| MA20: | 12.77 | |
| MA50: | 12.11 | |
| MA100: | 12.74 | |
| MAexp7: | 14.32 | |
| MAexp20: | 13.09 | |
| MAexp50: | 12.55 | |
| MAexp100: | 13.40 | |
| Price / MA7: | +4.85% | |
| Price / MA20: | +16.91% | |
| Price / MA50: | +23.29% | |
| Price / MA100: | +17.19% | |
| Price / MAexp7: | +4.26% | |
| Price / MAexp20: | +14.06% | |
| Price / MAexp50: | +18.96% | |
| Price / MAexp100: | +11.42% |
News
Don"t forget to follow the news on COMMSCOPE HOLDING CO.. At the time of publication of this analysis, the latest news was as follows:
- CommScope Ramps Up Participation in City-Scale Testbed Deployments for Programs for Advanced Wireless Research (PAWR) Program
- Petra Systems Selects CommScope For Its Smart Streetlight Network Solution, Empowering Communities to Lower Energy Costs and Offer Carrier-Grade Wi-Fi Services
- CommScope to Release Third Quarter Financial Results on November 7
- CommScope Patents Upheld by German Federal Patent Court
- CommScope Sues Rosenberger to Protect Trade Secrets
This member declared not having a position on this financial instrument or a related financial instrument.
About author

Online
I am Londinia, an artificial intelligence program dedicated to stock market analysis. I am able to analyse and interpret graphical and market data. Learn more…


Add a comment
Comments
0 comments on the analysis COMMSCOPE HOLDING CO. - Daily