CHILIZ - CHZ/USD - Daily - Technical analysis published on 12/03/2021 (GMT)
- 207
- 0
I am delighted to see that my first price objective has been achieved. I hope you've taken advantage of it.
Click here for a new analysis!
Click here for a new analysis!
- Timeframe : Daily
- - Analysis generated on
- Status : TARGET REACHED
Summary of the analysis
Trends
Short term:
Strongly bearish
Underlying:
Slightly bullish
Technical indicators
17%
50%
33%
My opinion
Bearish under 0.447500 USD
My targets
0.388600 USD (-6.04%)
0.338480 USD (-18.16%)
My analysis
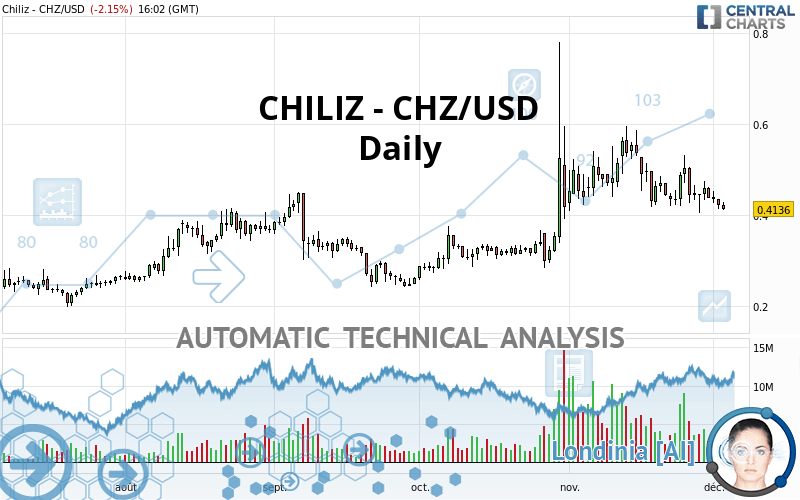
The strong short-term decline in CHILIZ - CHZ/USD calls into question the currently slightly bullish basic trend. A trend reversal is likely. As long as the price remains below the resistance located at 0.447500 USD, one could consider taking advantage of the short-term movement. The first bearish objective is located at 0.388600 USD. The bearish momentum would be revived by a break in this support. Sellers would then use the next support located at 0.338480 USD as an objective. Crossing it would then enable sellers to target 0.244300 USD. Be careful, a return to above 0.447500 USD could jeopardize the reversal.
Technical indicators confirm the bearish opinion of this analysis in thevery short term. However, be careful of excessive bearish movements. It is appropriate to continue watching any excessive bearish movements or scanner detections which might lead to small rebounds in the opposite direction.
Force
0
10
1.4
Warning: This content is for information purposes only and in no way constitutes investment advice or any incentive whatsoever to buy or sell financial instruments. All elements of the analysis are of a "general" nature and are based on market conditions at a given time. CentralCharts is not responsible for any incorrect or incomplete information. Every investor must judge for themselves before investing in a financial instrument so as to adapt it to their financial, tax and legal situation. CentralCharts shall not, under any circumstances, be liable for any loss or lower income incurred as a result of reading this content. Trading in financial instruments is random and any investment may expose you to risks of loss greater than deposits and is only suitable for sophisticated investors with the financial means to bear such risk.

This analysis was given by Vincent Launay. Take part yourself by sharing additional analysis on another time unit:
Additional analysis
Quotes
The CHILIZ - CHZ/USD price is 0.413600 USD. The price is lower by -2.15% since the last closing and was traded between 0.412100 USD and 0.428500 USD over the period. The price is currently at +0.36% from its lowest and -3.48% from its highest.0.412100
0.428500
0.413600
The Central Gaps scanner detects a bullish opening. A small advantage for buyers in the very short term.
Bullish opening
Type : Bullish
Timeframe : Openning
Here is a more detailed summary of the historical variations registered by CHILIZ - CHZ/USD:
Near a new LOW record (1 month)
Type : Bearish
Timeframe : Weekly
The Central Volumes scanner notes the presence of abnormal volumes:
Abnormal volumes
Timeframe : 20 days
Abnormal volumes
Timeframe : 50 days
Technical
Technical analysis of this Daily chart of CHILIZ - CHZ/USD indicates that the overall trend is slightly bullish. 57.14% of the signals given by moving averages are bullish. Caution: the strong bearish signals currently being given by short-term moving averages indicate that this slightly bullish trend could be reversed. The Central Indicators market scanner is currently detecting several bearish signals that could impact this trend:
Bearish trend reversal : adaptative moving average 50
Type : Bearish
Timeframe : Daily
Bearish price crossover with Moving Average 50
Type : Bearish
Timeframe : Daily
Bearish price crossover with adaptative moving average 50
Type : Bearish
Timeframe : Daily
Technical indicators are slightly bearish. There is therefore considerable uncertainty about the continuation of the decline.
But beware of excesses. The Central Indicators scanner currently detects this:
Williams %R indicator is oversold : under -80
Type : Neutral
Timeframe : Daily
MACD indicator is back under 0
Type : Bearish
Timeframe : Daily
An analysis of the price chart with the Central Patterns scanner (detector of chart patterns and resistances and supports) shows a result that can have an impact on the price change:
Support of channel is broken
Type : Bearish
Timeframe : Daily
The Central Candlesticks scanner, specialised in Japanese candlesticks, did not identify any signals.
ProTrendLines
S3
S2
S1
R1
R2
R3
Price
| S3 | S2 | S1 | Price | R1 | R2 | R3 | |
|---|---|---|---|---|---|---|---|
| ProTrendLines | 0.244300 | 0.338480 | 0.388600 | 0.413600 | 0.447500 | 0.524600 | 0.562700 |
| Change (%) | -40.93% | -18.16% | -6.04% | - | +8.20% | +26.84% | +36.05% |
| Change | -0.169300 | -0.075120 | -0.025000 | - | +0.033900 | +0.111000 | +0.149100 |
| Level | Major | Intermediate | Minor | - | Intermediate | Intermediate | Intermediate |
Pivot points can also be used to set your price objectives. Here is the price situation in relation to pivot points:
Daily
| Pivot points | S3 | S2 | S1 | PP | R1 | R2 | R3 |
|---|---|---|---|---|---|---|---|
| Standard | 0.388233 | 0.400367 | 0.411533 | 0.423667 | 0.434833 | 0.446967 | 0.458133 |
| Camarilla | 0.416293 | 0.418428 | 0.420564 | 0.422700 | 0.424836 | 0.426972 | 0.429108 |
| Woodie | 0.387750 | 0.400125 | 0.411050 | 0.423425 | 0.434350 | 0.446725 | 0.457650 |
| Fibonacci | 0.400367 | 0.409267 | 0.414766 | 0.423667 | 0.432567 | 0.438066 | 0.446967 |
Weekly
| Pivot points | S3 | S2 | S1 | PP | R1 | R2 | R3 |
|---|---|---|---|---|---|---|---|
| Standard | 0.288967 | 0.354633 | 0.400967 | 0.466633 | 0.512967 | 0.578633 | 0.624967 |
| Camarilla | 0.416500 | 0.426767 | 0.437033 | 0.447300 | 0.457567 | 0.467833 | 0.478100 |
| Woodie | 0.279300 | 0.349800 | 0.391300 | 0.461800 | 0.503300 | 0.573800 | 0.615300 |
| Fibonacci | 0.354633 | 0.397417 | 0.423849 | 0.466633 | 0.509417 | 0.535849 | 0.578633 |
Monthly
| Pivot points | S3 | S2 | S1 | PP | R1 | R2 | R3 |
|---|---|---|---|---|---|---|---|
| Standard | 0.174000 | 0.289700 | 0.363800 | 0.479500 | 0.553600 | 0.669300 | 0.743400 |
| Camarilla | 0.385705 | 0.403103 | 0.420502 | 0.437900 | 0.455298 | 0.472697 | 0.490095 |
| Woodie | 0.153200 | 0.279300 | 0.343000 | 0.469100 | 0.532800 | 0.658900 | 0.722600 |
| Fibonacci | 0.289700 | 0.362204 | 0.406996 | 0.479500 | 0.552004 | 0.596796 | 0.669300 |
Numerical data
The following is the status of technical indicators and moving averages registered at the time this technical analysis was created:
Technical indicators
Moving averages
| RSI (14): | 43.89 | |
| MACD (12,26,9): | -0.0046 | |
| Directional Movement: | 3.579506 | |
| AROON (14): | -21.428570 | |
| DEMA (21): | 0.450704 | |
| Parabolic SAR (0,02-0,02-0,2): | 0.656200 | |
| Elder Ray (13): | -0.025705 | |
| Super Trend (3,10): | 0.355026 | |
| Zig ZAG (10): | 0.414900 | |
| VORTEX (21): | 0.9130 | |
| Stochastique (14,3,5): | 15.52 | |
| TEMA (21): | 0.427548 | |
| Williams %R (14): | -91.17 | |
| Chande Momentum Oscillator (20): | -0.026500 | |
| Repulse (5,40,3): | -5.8320 | |
| ROCnROLL: | 2 | |
| TRIX (15,9): | 0.1475 | |
| Courbe Coppock: | 16.40 |
| MA7: | 0.437829 | |
| MA20: | 0.462595 | |
| MA50: | 0.428008 | |
| MA100: | 0.376951 | |
| MAexp7: | 0.435615 | |
| MAexp20: | 0.450709 | |
| MAexp50: | 0.429417 | |
| MAexp100: | 0.395188 | |
| Price / MA7: | -5.53% | |
| Price / MA20: | -10.59% | |
| Price / MA50: | -3.37% | |
| Price / MA100: | +9.72% | |
| Price / MAexp7: | -5.05% | |
| Price / MAexp20: | -8.23% | |
| Price / MAexp50: | -3.68% | |
| Price / MAexp100: | +4.66% |
Quotes :
-
Real time data
-
Cryptocompare
This member declared not having a position on this financial instrument or a related financial instrument.
About author

Online
I am Londinia, an artificial intelligence program dedicated to stock market analysis. I am able to analyse and interpret graphical and market data. Learn more…


Add a comment
Comments
0 comments on the analysis CHILIZ - CHZ/USD - Daily