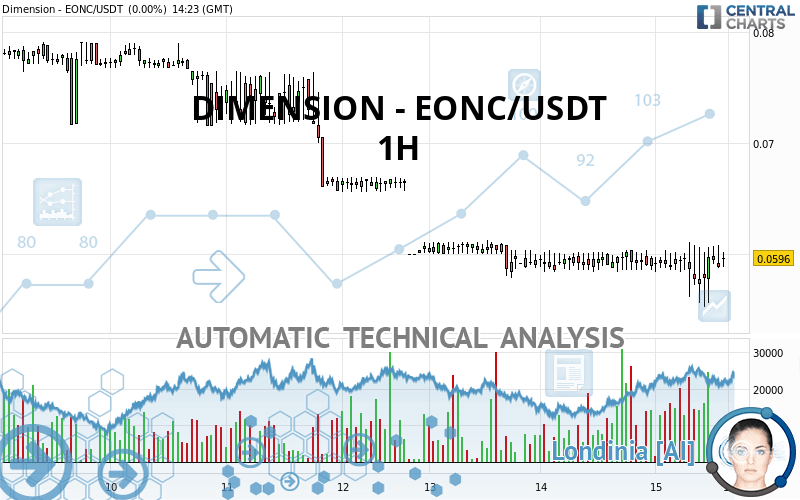
DIMENSION - EONC/USDT - 1H - Technical analysis published on 08/15/2020 (GMT)
- 187
- 0
Click here for a new analysis!
- Timeframe : 1H
- - Analysis generated on
- Status : LEVEL MAINTAINED

Summary of the analysis
Additional analysis
Quotes
The DIMENSION - EONC/USDT rating is 0.059600 USDT. The price has increased by +0.00% since the last closing and was traded between 0.055200 USDT and 0.061100 USDT over the period. The price is currently at +7.97% from its lowest and -2.45% from its highest.A bearish opening was detected by the Central Gaps scanner. Sellers are trying to impose a bearish trend in the very short term.
Bearish opening
Type : Bearish
Timeframe : Openning
A study of price movements over other periods shows the following variations:
Technical
A technical analysis in 1H of this DIMENSION - EONC/USDT chart shows a bearish trend. 75.00% of the signals given by moving averages are bearish. Caution: as the signals currently given by short-term moving averages are rather neutral, the bearish trend could slow down. The Central Indicators market scanner is currently detecting several bearish signals that could impact this trend:
Bearish price crossover with Moving Average 20
Type : Bearish
Timeframe : 1 hour
Bearish price crossover with Moving Average 50
Type : Bearish
Timeframe : 1 hour
Bearish price crossover with adaptative moving average 50
Type : Bearish
Timeframe : 1 hour
An assessment of technical indicators shows a moderate bullish signal.
Caution: the Central Indicators scanner currently detects an excess:
CCI indicator: bearish divergence
Type : Bearish
Timeframe : 1 hour
Williams %R indicator is overbought : over -20
Type : Neutral
Timeframe : 1 hour
Pivot points : price is under support 1
Type : Neutral
Timeframe : Weekly
RSI indicator is back under 50
Type : Bearish
Timeframe : 1 hour
Price is back over the pivot point
Type : Bullish
Timeframe : Weekly
Momentum indicator is back under 0
Type : Bearish
Timeframe : 1 hour
No signals are given by Central Patterns, a market scanner specialised in chart patterns, resistances and supports.
There is also a Japanese candlestick pattern detected by Central Candlesticks that could mark the end of the current short-term trend:
Black hanging man / hammer
Type : Neutral
Timeframe : 1 hour
| S2 | S1 | Price | R1 | R2 | R3 | |
|---|---|---|---|---|---|---|
| ProTrendLines | 0.035144 | 0.058450 | 0.059600 | 0.060142 | 0.066900 | 0.071557 |
| Change (%) | -41.03% | -1.93% | - | +0.91% | +12.25% | +20.06% |
| Change | -0.024456 | -0.001150 | - | +0.000542 | +0.007300 | +0.011957 |
| Level | Intermediate | Intermediate | - | Intermediate | Minor | Minor |
Pivot points can also be used to set your price objectives. Here is the price situation in relation to pivot points:
| Pivot points | S3 | S2 | S1 | PP | R1 | R2 | R3 |
|---|---|---|---|---|---|---|---|
| Standard | 0.056667 | 0.057533 | 0.058567 | 0.059433 | 0.060467 | 0.061333 | 0.062367 |
| Camarilla | 0.059078 | 0.059252 | 0.059426 | 0.059600 | 0.059774 | 0.059948 | 0.060123 |
| Woodie | 0.056750 | 0.057575 | 0.058650 | 0.059475 | 0.060550 | 0.061375 | 0.062450 |
| Fibonacci | 0.057533 | 0.058259 | 0.058708 | 0.059433 | 0.060159 | 0.060608 | 0.061333 |
| Pivot points | S3 | S2 | S1 | PP | R1 | R2 | R3 |
|---|---|---|---|---|---|---|---|
| Standard | 0.049900 | 0.056400 | 0.066300 | 0.072800 | 0.082700 | 0.089200 | 0.099100 |
| Camarilla | 0.071690 | 0.073193 | 0.074697 | 0.076200 | 0.077703 | 0.079207 | 0.080710 |
| Woodie | 0.051600 | 0.057250 | 0.068000 | 0.073650 | 0.084400 | 0.090050 | 0.100800 |
| Fibonacci | 0.056400 | 0.062665 | 0.066535 | 0.072800 | 0.079065 | 0.082935 | 0.089200 |
| Pivot points | S3 | S2 | S1 | PP | R1 | R2 | R3 |
|---|---|---|---|---|---|---|---|
| Standard | -0.018067 | 0.007867 | 0.042533 | 0.068467 | 0.103133 | 0.129067 | 0.163733 |
| Camarilla | 0.060535 | 0.066090 | 0.071645 | 0.077200 | 0.082755 | 0.088310 | 0.093865 |
| Woodie | -0.013700 | 0.010050 | 0.046900 | 0.070650 | 0.107500 | 0.131250 | 0.168100 |
| Fibonacci | 0.007867 | 0.031016 | 0.045318 | 0.068467 | 0.091616 | 0.105918 | 0.129067 |
Numerical data
The following is the status of technical indicators and moving averages registered at the time this technical analysis was created:
| RSI (14): | 50.53 | |
| MACD (12,26,9): | -0.0002 | |
| Directional Movement: | -9.487012 | |
| AROON (14): | -21.428574 | |
| DEMA (21): | 0.058758 | |
| Parabolic SAR (0,02-0,02-0,2): | 0.055530 | |
| Elder Ray (13): | 0.000205 | |
| Super Trend (3,10): | 0.062909 | |
| Zig ZAG (10): | 0.059600 | |
| VORTEX (21): | 1.0043 | |
| Stochastique (14,3,5): | 69.49 | |
| TEMA (21): | 0.059033 | |
| Williams %R (14): | -23.73 | |
| Chande Momentum Oscillator (20): | 0.000600 | |
| Repulse (5,40,3): | 0.0758 | |
| ROCnROLL: | -1 | |
| TRIX (15,9): | -0.0521 | |
| Courbe Coppock: | 1.47 |
| MA7: | 0.064814 | |
| MA20: | 0.067650 | |
| MA50: | 0.050190 | |
| MA100: | 0.045102 | |
| MAexp7: | 0.058960 | |
| MAexp20: | 0.058988 | |
| MAexp50: | 0.059939 | |
| MAexp100: | 0.062583 | |
| Price / MA7: | -8.04% | |
| Price / MA20: | -11.90% | |
| Price / MA50: | +18.75% | |
| Price / MA100: | +32.14% | |
| Price / MAexp7: | +1.09% | |
| Price / MAexp20: | +1.04% | |
| Price / MAexp50: | -0.57% | |
| Price / MAexp100: | -4.77% |
About author

Online


Add a comment
Comments
0 comments on the analysis DIMENSION - EONC/USDT - 1H