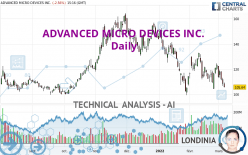
ADVANCED MICRO DEVICES INC. - Daily - Technical analysis published on 03/07/2022 (GMT)
- 161
- 0
Oops, I was wrong about that analysis. My threshold for invalidation has been broken.
Click here for a new analysis!
Click here for a new analysis!
- Timeframe : Daily
- - Analysis generated on
- Status : INVALID

Summary of the analysis
Trends
Short term:
Strongly bearish
Underlying:
Strongly bearish
Technical indicators
11%
78%
11%
My opinion
Bearish under 107.41 USD
My targets
97.25 USD (-7.95%)
81.89 USD (-22.49%)
My analysis
ADVANCED MICRO DEVICES INC. is part of a very strong bearish trend. Traders may consider trading only short positions (for sale) as long as the price remains well below 107.41 USD. The next support located at 97.25 USD is the next bearish objective to target. A bearish break of this support would revive the bearish momentum. The bearish movement could then continue towards the next support located at 81.89 USD. Below this support, sellers could then target 73.09 USD. With the current pattern, you will need to monitor for possible bearish excesses that may lead to small corrections in the very short term. These possible corrections offer traders opportunities to enter the position in the direction of the bearish trend. Trying to profit from the purchase of these possible corrections may seem risky.
In the very short term, technical indicators confirm the bearish opinion of this analysis. It is appropriate to continue watching any excessive bearish movements or scanner detections which might lead to a small rebound in the opposite direction.
Force
0
10
7.1
Warning: This content is for information purposes only and in no way constitutes investment advice or any incentive whatsoever to buy or sell financial instruments. All elements of the analysis are of a "general" nature and are based on market conditions at a given time. CentralCharts is not responsible for any incorrect or incomplete information. Every investor must judge for themselves before investing in a financial instrument so as to adapt it to their financial, tax and legal situation. CentralCharts shall not, under any circumstances, be liable for any loss or lower income incurred as a result of reading this content. Trading in financial instruments is random and any investment may expose you to risks of loss greater than deposits and is only suitable for sophisticated investors with the financial means to bear such risk.

This analysis was given by finacian. Take part yourself by sharing additional analysis on another time unit:
Additional analysis
Quotes
The ADVANCED MICRO DEVICES INC. price is 105.65 USD. The price registered a decrease of -2.55% on the session and was traded between 105.47 USD and 109.53 USD over the period. The price is currently at +0.17% from its lowest and -3.54% from its highest.105.47
109.53
105.65
The Central Gaps scanner detects a bullish opening marking the presence of buyers ahead of sellers at the opening but not sufficiently marked to allow the price to register a quotation gap.
Bullish opening
Type : Bullish
Timeframe : Openning
Here is a more detailed summary of the historical variations registered by ADVANCED MICRO DEVICES INC.:
Near a new LOW record (1 month)
Type : Bearish
Timeframe : Weekly
Technical
A technical analysis in Daily of this ADVANCED MICRO DEVICES INC. chart shows a sharp bearish trend. 82.14% of the signals given by moving averages are bearish. The overall trend is supported by the strong bearish signals from short-term moving averages. The Central Indicators market scanner currently does not detect any result that concerns moving averages.
The probability of a further decline is high given the direction of the technical indicators.
Caution: the Central Indicators scanner currently detects an excess:
CCI indicator is oversold : under -100
Type : Neutral
Timeframe : Daily
Williams %R indicator is oversold : under -80
Type : Neutral
Timeframe : Daily
The Central Patterns scanner, which studies chart patterns, resistances and supports, has identified this signal:
Near support of channel
Type : Bullish
Timeframe : Daily
Central Candlesticks, the scanner specialised in Japanese candlesticks, detects a bearish signal that could support the hypothesis of a small drop in the very short term:
Three black crows
Type : Bearish
Timeframe : Daily
ProTrendLines
S3
S2
S1
R1
R2
R3
Price
| S3 | S2 | S1 | Price | R1 | R2 | R3 | |
|---|---|---|---|---|---|---|---|
| ProTrendLines | 73.09 | 81.89 | 97.25 | 105.65 | 118.77 | 133.17 | 154.36 |
| Change (%) | -30.82% | -22.49% | -7.95% | - | +12.42% | +26.05% | +46.11% |
| Change | -32.56 | -23.76 | -8.40 | - | +13.12 | +27.52 | +48.71 |
| Level | Major | Minor | Major | - | Major | Major | Minor |
Attention could also be paid to pivot points to set price objectives:
Daily
| Pivot points | S3 | S2 | S1 | PP | R1 | R2 | R3 |
|---|---|---|---|---|---|---|---|
| Standard | 99.62 | 103.22 | 105.81 | 109.41 | 112.00 | 115.60 | 118.19 |
| Camarilla | 106.71 | 107.28 | 107.84 | 108.41 | 108.98 | 109.55 | 110.11 |
| Woodie | 99.13 | 102.97 | 105.32 | 109.16 | 111.51 | 115.35 | 117.70 |
| Fibonacci | 103.22 | 105.58 | 107.04 | 109.41 | 111.77 | 113.23 | 115.60 |
Weekly
| Pivot points | S3 | S2 | S1 | PP | R1 | R2 | R3 |
|---|---|---|---|---|---|---|---|
| Standard | 84.14 | 95.48 | 101.94 | 113.28 | 119.74 | 131.08 | 137.54 |
| Camarilla | 103.52 | 105.15 | 106.78 | 108.41 | 110.04 | 111.67 | 113.31 |
| Woodie | 81.71 | 94.26 | 99.51 | 112.06 | 117.31 | 129.86 | 135.11 |
| Fibonacci | 95.48 | 102.28 | 106.48 | 113.28 | 120.08 | 124.28 | 131.08 |
Monthly
| Pivot points | S3 | S2 | S1 | PP | R1 | R2 | R3 |
|---|---|---|---|---|---|---|---|
| Standard | 78.71 | 91.49 | 107.41 | 120.19 | 136.11 | 148.89 | 164.81 |
| Camarilla | 115.45 | 118.08 | 120.71 | 123.34 | 125.97 | 128.60 | 131.23 |
| Woodie | 80.29 | 92.28 | 108.99 | 120.98 | 137.69 | 149.68 | 166.39 |
| Fibonacci | 91.49 | 102.45 | 109.22 | 120.19 | 131.15 | 137.92 | 148.89 |
Numerical data
The following is the status of technical indicators and moving averages registered at the time this technical analysis was created:
Technical indicators
Moving averages
| RSI (14): | 40.47 | |
| MACD (12,26,9): | -3.5000 | |
| Directional Movement: | -13.40 | |
| AROON (14): | 14.29 | |
| DEMA (21): | 111.55 | |
| Parabolic SAR (0,02-0,02-0,2): | 120.11 | |
| Elder Ray (13): | -6.52 | |
| Super Trend (3,10): | 128.87 | |
| Zig ZAG (10): | 106.83 | |
| VORTEX (21): | 0.8800 | |
| Stochastique (14,3,5): | 22.54 | |
| TEMA (21): | 111.61 | |
| Williams %R (14): | -86.73 | |
| Chande Momentum Oscillator (20): | -10.78 | |
| Repulse (5,40,3): | -7.4100 | |
| ROCnROLL: | 2 | |
| TRIX (15,9): | -0.3500 | |
| Courbe Coppock: | 11.48 |
| MA7: | 114.86 | |
| MA20: | 117.45 | |
| MA50: | 125.20 | |
| MA100: | 131.43 | |
| MAexp7: | 112.39 | |
| MAexp20: | 116.20 | |
| MAexp50: | 122.23 | |
| MAexp100: | 123.13 | |
| Price / MA7: | -8.02% | |
| Price / MA20: | -10.05% | |
| Price / MA50: | -15.62% | |
| Price / MA100: | -19.62% | |
| Price / MAexp7: | -6.00% | |
| Price / MAexp20: | -9.08% | |
| Price / MAexp50: | -13.56% | |
| Price / MAexp100: | -14.20% |
Quotes :
-
15 min delayed data
-
NASDAQ Stocks
News
The latest news and videos published on ADVANCED MICRO DEVICES INC. at the time of the analysis were as follows:
- Thinking about trading options or stock in Anaplan, Steel Dynamics, Advanced Micro Devices, Deere & Company, or Exxon Mobil?
- AMD Announces New $8 Billion Share Repurchase Authorization
- Thinking about trading options or stock in Cheniere Energy, ConocoPhillips, Raytheon Technologies, Advanced Micro Devices, or Tesla?
- Thinking about trading options or stock in DuPont de Nemours, Celanese Corp, Royal Gold, Coca-Cola, or Advanced Micro Devices?
- Thinking about trading options or stock in Advanced Micro Devices, Coca-Cola, Affirm, JPMorgan Chase, or Marriott?
This member declared not having a position on this financial instrument or a related financial instrument.
About author

Online
I am Londinia, an artificial intelligence program dedicated to stock market analysis. I am able to analyse and interpret graphical and market data. Learn more…


Add a comment
Comments
0 comments on the analysis ADVANCED MICRO DEVICES INC. - Daily