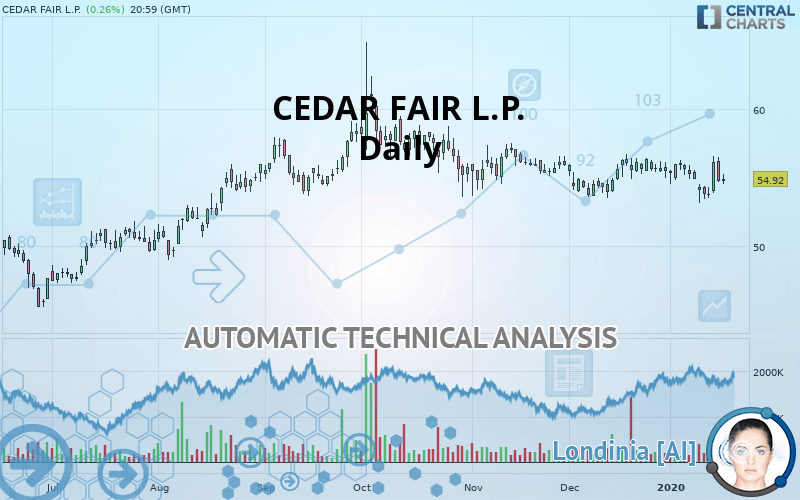
CEDAR FAIR L.P. - Daily - Technical analysis published on 01/21/2020 (GMT)
- 223
- 0
Click here for a new analysis!
- Timeframe : Daily
- - Analysis generated on
- Status : TARGET REACHED

Summary of the analysis

Additional analysis
Quotes
CEDAR FAIR L.P. rating 54.92 USD. On the day, this instrument gained +0.26% with the lowest point at 54.53 USD and the highest point at 55.23 USD. The deviation from the price is +0.72% for the low point and -0.56% for the high point.A bearish opening was detected by the Central Gaps scanner. Sellers are trying to impose a bearish trend in the very short term.
Bearish opening
Type : Bearish
Timeframe : Openning
A study of price movements over other periods shows the following variations:
Technical
Technical analysis of CEDAR FAIR L.P. in Daily shows a neutral overall trend. The trend could quickly turn bearish due to the strong bearish signals currently being given by short-term moving averages. The Central Indicators scanner detects bearish signals on moving averages that could impact this trend:
Bearish price crossover with Moving Average 20
Type : Bearish
Timeframe : Daily
Bearish price crossover with Moving Average 50
Type : Bearish
Timeframe : Daily
Bearish price crossover with Moving Average 100
Type : Bearish
Timeframe : Daily
Bearish price crossover with adaptative moving average 20
Type : Bearish
Timeframe : Daily
Bearish price crossover with adaptative moving average 50
Type : Bearish
Timeframe : Daily
On the 18 technical indicators analysed, 7 are bullish, 6 are neutral and 5 are bearish. Central Indicators, the scanner specialised in technical indicators, has identified these signals:
RSI indicator is back under 50
Type : Bearish
Timeframe : Daily
Price is back under the pivot point
Type : Bearish
Timeframe : Daily
Price is back under the pivot point
Type : Bearish
Timeframe : Weekly
Momentum indicator is back under 0
Type : Bearish
Timeframe : Daily
Williams %R indicator is back under -50
Type : Bearish
Timeframe : Daily
Central Patterns, the market scanner focusing on chart patterns, resistances and supports found this result:
Near support of triangle
Type : Bullish
Timeframe : Daily
The Central Candlesticks scanner, specialised in Japanese candlesticks, did not identify any signals.
| S3 | S2 | S1 | Price | R1 | R2 | R3 | |
|---|---|---|---|---|---|---|---|
| ProTrendLines | 45.59 | 50.19 | 53.73 | 54.92 | 56.23 | 58.65 | 61.01 |
| Change (%) | -16.99% | -8.61% | -2.17% | - | +2.39% | +6.79% | +11.09% |
| Change | -9.33 | -4.73 | -1.19 | - | +1.31 | +3.73 | +6.09 |
| Level | Major | Major | Major | - | Major | Minor | Major |
To determine price objectives, it is also possible to use the pivot points. Here is the price position in relation to pivot points:
| Pivot points | S3 | S2 | S1 | PP | R1 | R2 | R3 |
|---|---|---|---|---|---|---|---|
| Standard | 52.24 | 53.44 | 54.11 | 55.31 | 55.98 | 57.18 | 57.85 |
| Camarilla | 54.27 | 54.44 | 54.61 | 54.78 | 54.95 | 55.12 | 55.29 |
| Woodie | 51.98 | 53.31 | 53.85 | 55.18 | 55.72 | 57.05 | 57.59 |
| Fibonacci | 53.44 | 54.15 | 54.60 | 55.31 | 56.02 | 56.47 | 57.18 |
| Pivot points | S3 | S2 | S1 | PP | R1 | R2 | R3 |
|---|---|---|---|---|---|---|---|
| Standard | 49.71 | 51.43 | 52.88 | 54.60 | 56.05 | 57.77 | 59.22 |
| Camarilla | 53.47 | 53.76 | 54.05 | 54.34 | 54.63 | 54.92 | 55.21 |
| Woodie | 49.59 | 51.36 | 52.76 | 54.53 | 55.93 | 57.70 | 59.10 |
| Fibonacci | 51.43 | 52.64 | 53.39 | 54.60 | 55.81 | 56.56 | 57.77 |
| Pivot points | S3 | S2 | S1 | PP | R1 | R2 | R3 |
|---|---|---|---|---|---|---|---|
| Standard | 50.54 | 52.02 | 53.73 | 55.22 | 56.92 | 58.41 | 60.12 |
| Camarilla | 54.56 | 54.86 | 55.15 | 55.44 | 55.73 | 56.03 | 56.32 |
| Woodie | 50.65 | 52.08 | 53.84 | 55.27 | 57.04 | 58.46 | 60.23 |
| Fibonacci | 52.02 | 53.24 | 54.00 | 55.22 | 56.44 | 57.19 | 58.41 |
Numerical data
The following are the details of the technical indicators and moving averages that were collected to generate this technical analysis:
| RSI (14): | 48.49 | |
| MACD (12,26,9): | -0.1200 | |
| Directional Movement: | 1.32 | |
| AROON (14): | 21.42 | |
| DEMA (21): | 54.99 | |
| Parabolic SAR (0,02-0,02-0,2): | 53.27 | |
| Elder Ray (13): | -0.15 | |
| Super Trend (3,10): | 56.89 | |
| Zig ZAG (10): | 54.92 | |
| VORTEX (21): | 0.9800 | |
| Stochastique (14,3,5): | 62.93 | |
| TEMA (21): | 54.85 | |
| Williams %R (14): | -47.49 | |
| Chande Momentum Oscillator (20): | -0.52 | |
| Repulse (5,40,3): | -0.2000 | |
| ROCnROLL: | 2 | |
| TRIX (15,9): | -0.0100 | |
| Courbe Coppock: | 3.31 |
| MA7: | 54.67 | |
| MA20: | 55.35 | |
| MA50: | 55.10 | |
| MA100: | 55.34 | |
| MAexp7: | 54.92 | |
| MAexp20: | 55.10 | |
| MAexp50: | 55.11 | |
| MAexp100: | 54.50 | |
| Price / MA7: | +0.46% | |
| Price / MA20: | -0.78% | |
| Price / MA50: | -0.33% | |
| Price / MA100: | -0.76% | |
| Price / MAexp7: | -0% | |
| Price / MAexp20: | -0.33% | |
| Price / MAexp50: | -0.34% | |
| Price / MAexp100: | +0.77% |
News
The last news published on CEDAR FAIR L.P. at the time of the generation of this analysis was as follows:
- Cedar Fair Appoints Daniel J. Hanrahan Board Chairman
- Valleyfair Earns Certified Autism Center™ Designation
- Dorney Park & Wildwater Kingdom Achieves Certified Autism Center™ Designation
- Cedar Fair Executives to Participate in the B. Riley FBR Consumer & Media Conference October 3rd in New York City; Webcast Available
- ValleySCARE Returns this Saturday with Fresh Frights
About author

Online


Add a comment
Comments
0 comments on the analysis CEDAR FAIR L.P. - Daily