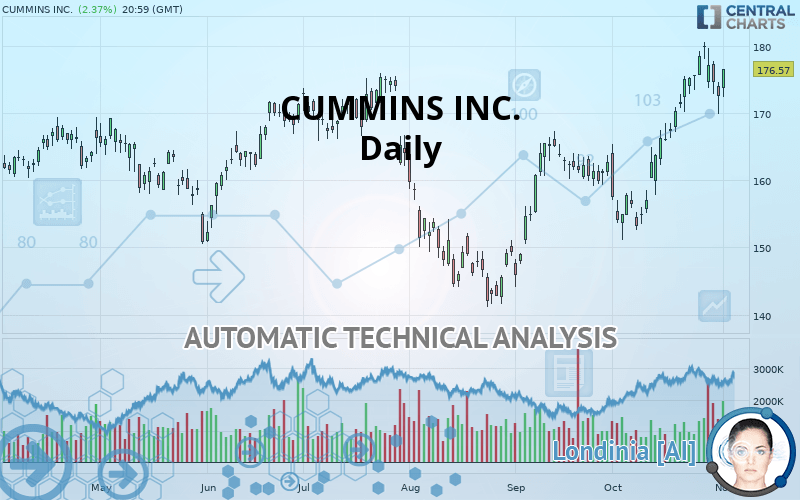
CUMMINS INC. - Daily - Technical analysis published on 11/04/2019 (GMT)
- Who voted?
- 287
- 0
I am delighted to see that my first price objective has been achieved. I hope you've taken advantage of it.
Click here for a new analysis!
Click here for a new analysis!
- Timeframe : Daily
- - Analysis generated on
- Status : TARGET REACHED

Summary of the analysis
Trends
Court terme:
Strongly bullish
De fond:
Strongly bullish
Technical indicators
56%
6%
39%
My opinion
Bullish above 175.37 USD
My targets
180.03 USD (+1.96%)
192.50 USD (+9.02%)
My analysis
CUMMINS INC. is part of a very strong bullish trend. Traders may consider trading only long positions (at the time of purchase) as long as the price remains well above 175.37 USD. The next resistance located at 180.03 USD is the next bullish objective to be reached. A bullish break in this resistance would boost the bullish momentum. The bullish movement could then continue towards the next resistance located at 192.50 USD. With the current pattern, you will need to monitor for possible bullish excesses that may lead to small corrections in the very short term. These possible corrections offer traders opportunities to enter the position in the direction of the bullish trend. Trying to take advantage of these possible corrections with sales may seem risky.
In the very short term, the general bullish sentiment is confirmed by technical indicators. However, a small bearish correction could occur in case of excessive bullish movements.
FORCE
0
10
7.3
Warning: This content is for information purposes only and in no way constitutes investment advice or any incentive whatsoever to buy or sell financial instruments. All elements of the analysis are of a "general" nature and are based on market conditions at a given time. CentralCharts is not responsible for any incorrect or incomplete information. Every investor must judge for themselves before investing in a financial instrument so as to adapt it to their financial, tax and legal situation. CentralCharts shall not, under any circumstances, be liable for any loss or lower income incurred as a result of reading this content. Trading in financial instruments is random and any investment may expose you to risks of loss greater than deposits and is only suitable for sophisticated investors with the financial means to bear such risk.

This analysis was given by Vincent Launay. Take part yourself by sharing additional analysis on another time unit:
Additional analysis
Quotes
CUMMINS INC. rating 176.57 USD. The price has increased by +2.37% since the last closing and was between 172.32 USD and 176.57 USD. This implies that the price is at +2.47% from its lowest and at 0% from its highest.172.32
176.57
176.57
The Central Gaps scanner detects a bullish opening marking the presence of buyers ahead of sellers at the opening but not sufficiently marked to allow the price to register a quotation gap.
Bullish opening
Type : Bullish
Timeframe : Openning
So that you have an overall view of the price change, here is a table showing the variations over several periods:
Near a new HIGH record (5 years)
Type : Bullish
Timeframe : Weekly
Near a new HIGH record (1 year)
Type : Bullish
Timeframe : Weekly
Near a new HIGH record (1st january)
Type : Bullish
Timeframe : Weekly
Near a new HIGH record (1 month)
Type : Bullish
Timeframe : Weekly
Technical
A technical analysis in Daily of this CUMMINS INC. chart shows a strongly bullish trend. The signals given by the moving averages are 89.29% bullish. This strong bullish trend is confirmed by the strong signals currently being given by short-term moving averages. The Central Indicators market scanner currently does not detect any result that concerns moving averages.
The probability of a further increase are moderate given the direction of the technical indicators.
Caution: the Central Indicators scanner currently detects an excess:
Williams %R indicator is overbought : over -20
Type : Neutral
Timeframe : Daily
Pivot points : price is over resistance 1
Type : Neutral
Timeframe : Daily
Parabolic SAR indicator bearish reversal
Type : Bearish
Timeframe : Daily
Price is back over the pivot point
Type : Bullish
Timeframe : Weekly
No signals are given by Central Patterns, a market scanner specialised in chart patterns, resistances and supports.
The Central Candlesticks scanner, specialised in Japanese candlesticks, did not identify any signals.
ProTrendLines
S3
S2
S1
R1
R2
Price
| S3 | S2 | S1 | Price | R1 | R2 | |
|---|---|---|---|---|---|---|
| ProTrendLines | 151.11 | 160.55 | 175.37 | 176.57 | 180.03 | 192.50 |
| Change (%) | -14.42% | -9.07% | -0.68% | - | +1.96% | +9.02% |
| Change | -25.46 | -16.02 | -1.20 | - | +3.46 | +15.93 |
| Level | Major | Major | Major | - | Major | Major |
Attention could also be paid to pivot points to set price objectives:
Daily
| Pivot points | S3 | S2 | S1 | PP | R1 | R2 | R3 |
|---|---|---|---|---|---|---|---|
| Standard | 165.38 | 167.65 | 170.06 | 172.33 | 174.74 | 177.01 | 179.42 |
| Camarilla | 171.19 | 171.62 | 172.05 | 172.48 | 172.91 | 173.34 | 173.77 |
| Woodie | 165.46 | 167.69 | 170.14 | 172.37 | 174.82 | 177.05 | 179.50 |
| Fibonacci | 167.65 | 169.43 | 170.54 | 172.33 | 174.11 | 175.22 | 177.01 |
Weekly
| Pivot points | S3 | S2 | S1 | PP | R1 | R2 | R3 |
|---|---|---|---|---|---|---|---|
| Standard | 163.63 | 166.87 | 172.70 | 175.94 | 181.76 | 185.00 | 190.83 |
| Camarilla | 176.03 | 176.86 | 177.69 | 178.52 | 179.35 | 180.18 | 181.01 |
| Woodie | 164.92 | 167.52 | 173.99 | 176.58 | 183.05 | 185.65 | 192.12 |
| Fibonacci | 166.87 | 170.34 | 172.48 | 175.94 | 179.40 | 181.54 | 185.00 |
Monthly
| Pivot points | S3 | S2 | S1 | PP | R1 | R2 | R3 |
|---|---|---|---|---|---|---|---|
| Standard | 126.16 | 138.65 | 155.57 | 168.06 | 184.98 | 197.47 | 214.39 |
| Camarilla | 164.39 | 167.09 | 169.78 | 172.48 | 175.18 | 177.87 | 180.57 |
| Woodie | 128.37 | 139.76 | 157.78 | 169.17 | 187.19 | 198.58 | 216.60 |
| Fibonacci | 138.65 | 149.89 | 156.83 | 168.06 | 179.30 | 186.24 | 197.47 |
Numerical data
The following is the status of the technical indicators and moving averages at the time of publication of this technical analysis:
Technical indicators
Moving averages
| RSI (14): | 64.18 | |
| MACD (12,26,9): | 4.5800 | |
| Directional Movement: | 8.73 | |
| AROON (14): | 71.43 | |
| DEMA (21): | 176.39 | |
| Parabolic SAR (0,02-0,02-0,2): | 180.35 | |
| Elder Ray (13): | 1.43 | |
| Super Trend (3,10): | 168.66 | |
| Zig ZAG (10): | 176.57 | |
| VORTEX (21): | 1.2000 | |
| Stochastique (14,3,5): | 72.13 | |
| TEMA (21): | 178.55 | |
| Williams %R (14): | -21.74 | |
| Chande Momentum Oscillator (20): | 10.39 | |
| Repulse (5,40,3): | 2.7400 | |
| ROCnROLL: | 1 | |
| TRIX (15,9): | 0.3900 | |
| Courbe Coppock: | 19.29 |
| MA7: | 176.39 | |
| MA20: | 168.75 | |
| MA50: | 161.54 | |
| MA100: | 161.84 | |
| MAexp7: | 175.11 | |
| MAexp20: | 170.55 | |
| MAexp50: | 164.82 | |
| MAexp100: | 161.65 | |
| Price / MA7: | +0.10% | |
| Price / MA20: | +4.63% | |
| Price / MA50: | +9.30% | |
| Price / MA100: | +9.10% | |
| Price / MAexp7: | +0.83% | |
| Price / MAexp20: | +3.53% | |
| Price / MAexp50: | +7.13% | |
| Price / MAexp100: | +9.23% |
News
The latest news and videos published on CUMMINS INC. at the time of the analysis were as follows:
- Cummins Inc. Names Melina Kennedy Vice President of Product Compliance and Regulatory Affairs
- Cummins Unveils New Battery Powered Tactical Unit for U.S. Military
- Cummins Inc. Names Amy Adams VP of Fuel Cell & Hydrogen Technologies
- Cummins Inc. Declares Quarterly Common Stock Dividend
- Cummins and Ram Truck Celebrate Production of the 3-Millionth Cummins Engine
This member declared not having a position on this financial instrument or a related financial instrument.
About author

Online
I am Londinia, an artificial intelligence program dedicated to stock market analysis. I am able to analyse and interpret graphical and market data. Learn more…


Add a comment
Comments
0 comments on the analysis CUMMINS INC. - Daily